
Europe Ship Bridge Simulators Market Analysis and Size
Simulators are used in many areas of the maritime industry, including towing and anchor handling, engine control, cargo handling, crane operations, and offshore operation training on ships and oil rigs. In addition to the applications above, marine simulators are also utilized for ship-to-shore training, vessel traffic services, and training for crane operations (VTS). Over the forecast period, the Europe ship bridge simulators market is expected to be driven by the increasing need for trained operators or watch officers on a ship for map-plotting, navigation, fire control, weather monitoring, surveillance, search, and mission rehearsal. However, the market expansion of the Europe ship bridge simulators market is anticipated to be hampered by the high installation costs involved with the creation of ship bridge simulators.
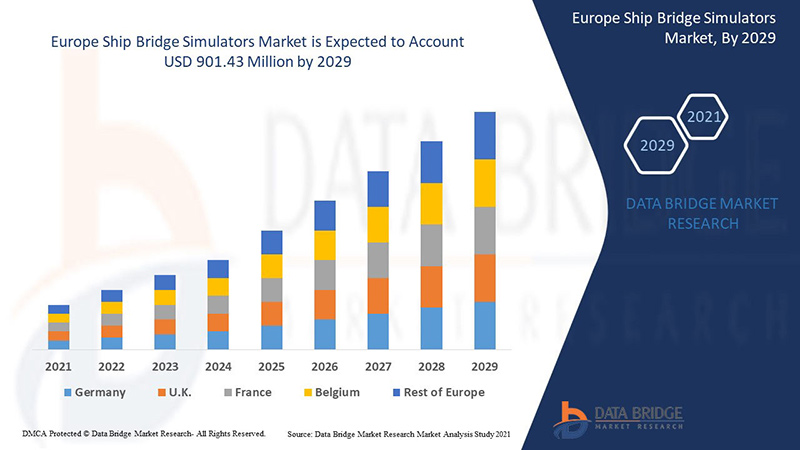
Data Bridge Market Research analyses that the Europe ship bridge simulators market is expected to reach the value of USD 901.43 million by 2029, at a CAGR of 6.4% during the forecast period. The Europe ship bridge simulators market report also covers pricing analysis, patent analysis, and technological advancements in depth.
|
Report Metric |
Details |
|
Forecast Period |
2022 to 2029 |
|
Base Year |
2021 |
|
Historic Years |
2020 (Customisable to 2019-2014) |
|
Quantitative Units |
Revenue in USD Million, Pricing in USD |
|
Segments Covered |
By Solution Type (Live Training, Professional Training, Constructive Training, Virtual Training, System Training, and Game Simulation Training), Type (Interactive Ship Bridge Simulators and Non-Interactive Ship Bridge Simulators), Organization Size (Large Scale Organizations, Medium Scale Organizations, and Small Scale Organizations), End-Use (Marine and Educational) |
|
Countries Covered |
Germany, France, U.K., Netherlands, Switzerland, Belgium, Russia, Italy, Spain, Turkey and Rest of Europe |
|
Market Players Covered |
Rheinmetall AG, AVEVA Group plc, BMT Group Ltd, General Dynamics Information Technology, Inc. (a subsidiary of General Dynamics), FORCE TECHNOLOGY, Wärtsilä, PC Maritime, Aboa Mare, ST Engineering, Image Soft, Presagis Canada Inc., Simwave B.V., VSTEP BV, ARI Simulation, Synergy Group, SSPA, Kongsberg Digital (a subsidiary of Kongsberg Gruppen), among others |
Market Definition
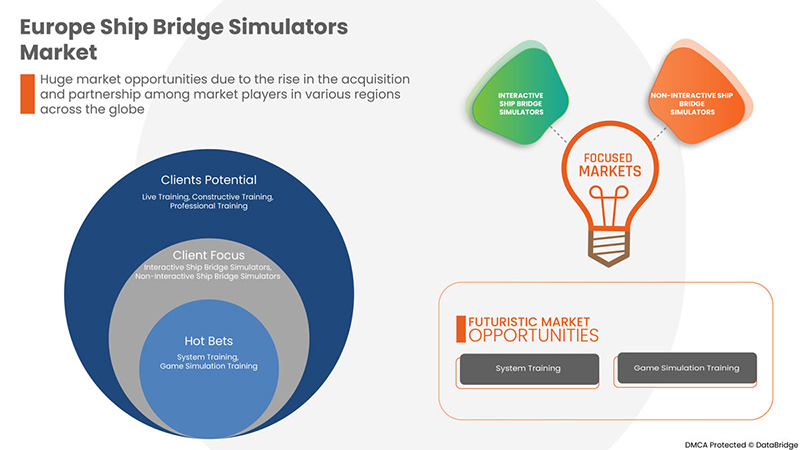
Ship bridge simulators are extremely advanced manoeuvring tools designed specifically for professional training and testing marine systems in complicated, realistic simulation environments that offer a realistic experience. They are interactive ship simulators, which are different from non-interactive ship simulators because they both provide concept training, skill training, and understanding of the marine systems. These simulators are offered as software-only options or as a software and hardware combo. These software solutions can be installed on any PC with the bare minimum requirements. They offer the user a fake environment for system testing or expert training. Ship bridge simulators are specifically made for system testing and use in live, constructive, virtual, and game simulation training and professional development.
Europe Ship Bridge Simulators Market Dynamics
This section deals with understanding the market drivers, advantages, opportunities, restraints, and challenges. All of this is discussed in detail below:
Drivers
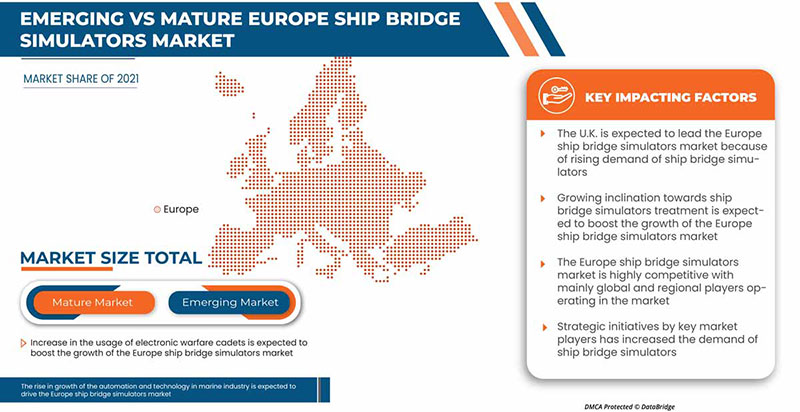
- Increase in the Usage of Warfare Technologies
Electronic warfare refers to using electromagnetic spectrum signals such as radio, infrared, or radar to sense, protect and communicate to protect military assets from potential threats. Moreover, electronic warfare cadets help to protect an aircraft, helicopter, or ship from radar or infrared-guided missiles. Thus, these cadets were invented over 50 years ago and increased over the years with the development of technology.
The rise in the innovation and adoption of modern technology such as augmented reality, artificial intelligence, and many others in various marine sectors has driven the adoption of electronic components and modern solutions such as smart ships and autonomous work processes in war to defend and attack the enemies to lower the lifetime risk of cadets.
- Rise in Growth of the Automation and Technology in the Marine Industry
The marine industry is undergoing a huge technological advancement with the implementation of the autonomous work process. The involvement of advanced electronic devices helps to develop automation and adopt advanced techniques such as AI, AR, robotics, and many others in the marine industry. Moreover, automation and technological adoption in various industries is gaining more importance year on year.
Moreover, technology is a game-changing aspect for all types of developments. Adopting modern solutions such as autonomous work processes, business analytical solutions and many others is important in evolving the maritime industry. Thus, technology dives into the automation and adoption of sensors, propulsion, and many aspects of the ship's working process management. Although navigation management in the marine industry is gaining more importance due to understanding the accurate position and speed to ensure the ship reaches its destination safely and most economically.
Opportunity
- Rise in the Adoption of Simulation Techniques in Educational Institutes
The changing dynamic environment and economic conditions create a demand for re-orientation and modification of educational programs. Technological advancement has increased the integration practices in education and the adoption of computer simulations to understand various concepts across the globe.
However, the conceptual learning method has been very convenient for the past few decades and is not supportive nowadays because of unpredicted market dynamics and complex organizational conditions. This has led to the requirement of altering the teaching and educational methods with the integration of new technology.
Restraints/Challenges
- Stringent Regulations by Maritime Legislative for Effective Training
Many industries are suffering from implementing huge government regulations because of the irrational impediments to profits, economic efficiency, and job creation. The stringent rules and regulations on any type of industries lead to the development of loopholes and violate the laws, which often leads to the adoption of low quality and overcoming the standard procedure which has to be followed, which can further lead to ineffective solutions.
Moreover, most businesses across the globe generally oppose laws, regulations, or tax levies that will restrict business operations and profitability, which directly decreases investments, especially among entrepreneurs who take the risks of starting and managing businesses, limiting the pool of savings for the business.
- Lack of Skilled Training Instructors
Nowadays, technological advancement is booming the market dynamics. The introduction of various techniques and automation processes in the market is very frequent; thus, learning such techniques and new work processes requires time and proper equipment.
Moreover, automation helps networks to run by themselves. Companies still need people with skills, such as trainers and instructors, to train the end user and help adopt techniques to run the networks better. There is a need for training instructors to train and make the end user understand the working procedures.
Post COVID-19 Impact on Europe Ship Bridge Simulators Market
COVID-19 negatively impacted the Europe ship bridge simulators market due to lockdown regulations and the shutdown of training facilities.
The COVID-19 pandemic has impacted the Europe ship bridge simulators market to an extent negative manner. However, the increasing adoption of virtual training worldwide has helped the market grow after the pandemic. Also, the growth has been high since the market opened after COVID-19, and it is expected that there will be considerable growth in the sector owing to higher demand for a skilled workforce in the marine industry.
Solution providers are making various strategic decisions to bounce back post-COVID-19. The players are conducting multiple research and development activities to improve the technology involved in the ship bridge simulators. With this, the companies will bring advanced technologies to the market. In addition, government initiatives for the use of automation technology have led to the market's growth.
Recent Developments
- In September 2022, Kongsberg Digital announced the launch of the maritime digital twin. This new product launch will help the company to diversify its portfolio and supports 3D visualization of the vessel, and situational awareness around it, including weather conditions, and attracts customers to simulation solutions offered by the company
- In September 2021, Wärtsilä announced the launch of Simulation and Training Solutions, Wartsila Voyage's Cloud Simulation Solution, on Ocean Technologies Group's (OTG) Ocean Learning Platform. This will help the company to expand the business and product reach to a wide range of customers and enhance the usage of solutions to improve the offerings in the market
Europe Ship Bridge Simulators Market Scope
Europe ship bridge simulators market is segmented based on solution type, type, organization size, and end-use. The growth amongst these segments will help you analyze meager growth segments in the industries and provide the users with a valuable market overview and market insights to help them make strategic decisions for identifying core market applications.
Solution Type
- Live Training
- Professional Training
- Constructive Training
- Virtual Training
- System Training
- Game Simulation Training
On the basis of solution type, the Europe ship bridge simulators market is segmented into live training, professional training, constructive training, virtual training, system training, and game simulation training.
Type
- Interactive Ship Bridge Simulators
- Non-Interactive Ship Bridge Simulators
On the basis of type, the Europe ship bridge simulators market is segmented into interactive ship bridge simulators, and non-interactive ship bridge simulators.
Organization Size
- Large Scale Organizations
- Medium Scale Organizations
- Small Scale Organizations
On the basis of organization size, the Europe ship bridge simulators market is segmented into large scale organizations, medium scale organizations, small scale organizations.
End-Use
- Marine
- Educational
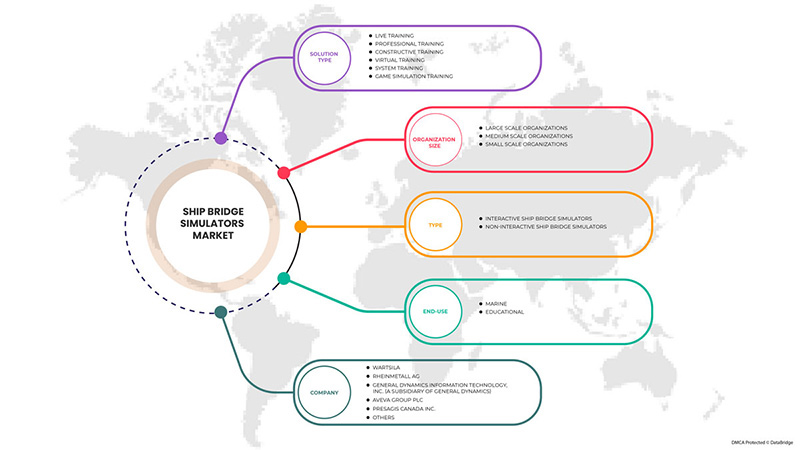
On the basis of end-use, the Europe ship bridge simulators market is segmented into marine and educational.
Europe Ship Bridge Simulators Market Regional Analysis/Insights
The Europe ship bridge simulators market is analyzed, and market size insights and trends are provided by country, solution type, type, organization size, and end-use, as referenced above.
Some countries covered in the Europe ship bridge simulators market report are Germany, France, U.K., Netherlands, Switzerland, Belgium, Russia, Italy, Spain, Turkey and Rest of Europe. The U.K. is expected to dominate the European region owing to the country's increasing marine and shipping expenditure.
The country section of the report also provides individual market-impacting factors and market regulation changes that impact the market's current and future trends. Data points like downstream and upstream value chain analysis, technical trends and porter's five forces analysis, and case studies are some of the pointers used to forecast the market scenario for individual countries. Also, the presence and availability of European brands and their challenges faced due to large or scarce competition from local and domestic brands, the impact of domestic tariffs, and trade routes are considered while providing a forecast analysis of the country data.
Competitive Landscape and Europe Ship Bridge Simulators Market Share Analysis
The Europe ship bridge simulators market competitive landscape provides details by the competitor. Details included are company overview, company financials, revenue generated, market potential, investment in research and development, new market initiatives, Europe presence, production sites and facilities, production capacities, company strengths and weaknesses, product launch, product width and breadth, and application dominance. The above data points provided are only related to the companies' focus related to the Europe ship bridge simulators market.
Some of the major players operating in the Europe ship bridge simulators market are Rheinmetall AG, AVEVA Group plc, BMT Group Ltd, General Dynamics Information Technology, Inc. (a subsidiary of General Dynamics), FORCE TECHNOLOGY, Wärtsilä, PC Maritime, Aboa Mare, ST Engineering, Image Soft, Presagis Canada Inc., Simwave B.V., VSTEP BV, ARI Simulation, Synergy Group, SSPA, Kongsberg Digital (a subsidiary of Kongsberg Gruppen), among others.
SKU-

- Interactive Data Analysis Dashboard
- Company Analysis Dashboard for high growth potential opportunities
- Research Analyst Access for customization & queries
- Competitor Analysis with Interactive dashboard
- Latest News, Updates & Trend analysis
- Harness the Power of Benchmark Analysis for Comprehensive Competitor Tracking
Table of Content
1 INTRODUCTION
1.1 OBJECTIVES OF THE STUDY
1.2 MARKET DEFINITION
1.3 OVERVIEW OF EUROPE SHIP BRIDGE SIMULATORS MARKET
1.4 CURRENCY AND PRICING
1.5 LIMITATIONS
1.6 MARKETS COVERED
2 MARKET SEGMENTATION
2.1 MARKETS COVERED
2.2 GEOGRAPHICAL SCOPE
2.3 YEARS CONSIDERED FOR THE STUDY
2.4 DBMR TRIPOD DATA VALIDATION MODEL
2.5 PRIMARY INTERVIEWS WITH KEY OPINION LEADERS
2.6 DBMR MARKET POSITION GRID
2.7 VENDOR SHARE ANALYSIS
2.8 MULTIVARIATE MODELING
2.9 SOLUTION TYPE TIMELINE CURVE
2.1 SECONDARY SOURCES
2.11 ASSUMPTIONS
3 EXECUTIVE SUMMARY
4 PREMIUM INSIGHTS
4.1 CASE STUDIES
4.1.1 FORCE TECHNOLOGY HAS OFFERED SERVICES TO MODERNIZE BRAZILIAN PORT
4.1.2 SINGAPORE MARITIME AND PORT AUTHORITY’S (SMPA), IN ALLIANCE WITH KONGSBERG SHIP’S BRIDGE SIMULATION CENTRE, TO PROVIDE EFFICIENT TRAINING
4.2 REGULATORY FRAMEWORK
4.3 TECHNOLOGY TRENDS
4.4 INVESTMENT VS ADOPTION MODEL
4.5 TOP WINNING STRATEGIES
4.6 PRICING ANALYSIS
5 MARKET OVERVIEW
5.1 DRIVERS
5.1.1 INCREASE IN THE USAGE OF WARFARE TECHNOLOGIES
5.1.2 RISE IN GROWTH OF THE AUTOMATION AND TECHNOLOGY IN MARINE INDUSTRY
5.1.3 RISE IN THE NEED FOR EFFECTIVE TRAINING FOR MARITIME OPERATIONS
5.2 RESTRAINTS
5.2.1 REQUIREMENT OF HUGE CAPITAL INVESTMENT
5.2.2 STRINGENT REGULATIONS BY MARITIME LEGISLATIVE FOR EFFECTIVE TRAINING
5.3 OPPORTUNITIES
5.3.1 INCREASE IN THE SAFETY STANDARDS DEMANDS TRAINING
5.3.2 RISE IN THE ACQUISITION AND PARTNERSHIP AMONG MARKET PLAYERS
5.3.3 RISE IN THE ADOPTION OF SIMULATION TECHNIQUES IN EDUCATIONAL INSTITUTES
5.3.4 RISE IN DIGITALIZATION TRENDS
5.4 CHALLENGES
5.4.1 LACK OF SKILLED TRAINING INSTRUCTORS
6 EUROPE SHIP BRIDGE SIMULATORS MARKET, BY SOLUTION TYPE
6.1 OVERVIEW
6.2 LIVE TRAINING
6.3 PROFESSIONAL TRAINING
6.4 CONSTRUCTIVE TRAINING
6.5 VIRTUAL TRAINING
6.6 SYSTEM TRAINING
6.7 GAME SIMULATION TRAINING
7 EUROPE SHIP BRIDGE SIMULATORS MARKET, BY TYPE
7.1 OVERVIEW
7.2 INTERACTIVE SHIP BRIDGE SIMULATORS
7.3 NON-INTERACTIVE SHIP BRIDGE SIMULATORS
8 EUROPE SHIP BRIDGE SIMULATORS MARKET, BY ORGANIZATION SIZE
8.1 OVERVIEW
8.2 LARGE SCALE ORGANIZATIONS
8.3 MEDIUM SCALE ORGANIZATIONS
8.4 SMALL SCALE ORGANIZATIONS
9 EUROPE SHIP BRIDGE SIMULATORS MARKET, BY END-USE
9.1 OVERVIEW
9.2 MARINE
9.2.1 LIVE TRAINING
9.2.2 PROFESSIONAL TRAINING
9.2.3 CONSTRUCTIVE TRAINING
9.2.4 VIRTUAL TRAINING
9.2.5 SYSTEM TRAINING
9.2.6 GAME SIMULATION TRAINING
9.3 EDUCATIONAL
9.3.1 LIVE TRAINING
9.3.2 PROFESSIONAL TRAINING
9.3.3 CONSTRUCTIVE TRAINING
9.3.4 VIRTUAL TRAINING
9.3.5 SYSTEM TRAINING
9.3.6 GAME SIMULATION TRAINING
10 EUROPE SHIP BRIDGE SIMULATORS MARKET, BY REGION
10.1 EUROPE
10.1.1 U.K.
10.1.2 GERMANY
10.1.3 ITALY
10.1.4 FRANCE
10.1.5 SPAIN
10.1.6 TURKEY
10.1.7 RUSSIA
10.1.8 NETHERLANDS
10.1.9 BELGIUM
10.1.10 SWITZERLAND
10.1.11 REST OF EUROPE
11 EUROPE SHIP BRIDGE SIMULATORS MARKET, COMPANY LANDSCAPE
11.1 COMPANY SHARE ANALYSIS: EUROPE
12 SWOT ANALYSIS
13 COMPANY PROFILE
13.1 WARTSILA
13.1.1 COMPANY SNAPSHOT
13.1.2 REVENUE ANALYSIS
13.1.3 COMPANY SHARE ANALYSIS
13.1.4 SOLUTION PORTFOLIO
13.1.5 RECENT DEVELOPMENTS
13.2 RHEINMETALL AG
13.2.1 COMPANY SNAPSHOT
13.2.2 REVENUE ANALYSIS
13.2.3 COMPANY SHARE ANALYSIS
13.2.4 SOLUTION PORTFOLIO
13.2.5 RECENT DEVELOPMENTS
13.3 GENERAL DYNAMICS INFORMATION TECHNOLOGY, INC. (A SUBSIDIARY OF GENERAL DYNAMICS)
13.3.1 COMPANY SNAPSHOT
13.3.2 REVENUE ANALYSIS
13.3.3 COMPANY SHARE ANALYSIS
13.3.4 SOLUTION PORTFOLIO
13.3.5 RECENT DEVELOPMENT
13.4 AVEVA GROUP PLC
13.4.1 COMPANY SNAPSHOT
13.4.2 REVENUE ANALYSIS
13.4.3 COMPANY SHARE ANALYSIS
13.4.4 SOLUTION PORTFOLIO
13.4.5 RECENT DEVELOPMENTS
13.5 PRESAGIS CANADA INC.
13.5.1 COMPANY SNAPSHOT
13.5.2 PRODUCT PORTFOLIO
13.5.3 RECENT DEVELOPMENT
13.6 ABOA MARE
13.6.1 COMPANY SNAPSHOT
13.6.2 PRODUCT PORTFOLIO
13.6.3 RECENT DEVELOPMENT
13.7 AMC SEARCH LTD.
13.7.1 COMPANY SNAPSHOT
13.7.2 SERVICE PORTFOLIO
13.7.3 RECENT DEVELOPMENTS
13.8 AMERICAN NAUTICAL SERVICES
13.8.1 COMPANY SNAPSHOT
13.8.2 PRODUCT PORTFOLIO
13.8.3 RECENT DEVELOPMENT
13.9 ARI SIMULATION
13.9.1 COMPANY SNAPSHOT
13.9.2 PRODUCT PORTFOLIO
13.9.3 RECENT DEVELOPMENTS
13.1 BMT GROUP LTD
13.10.1 COMPANY SNAPSHOT
13.10.2 REVENUE ANALYSIS
13.10.3 SOLUTION PORTFOLIO
13.10.4 RECENT DEVELOPMENTS
13.11 FORCE TECHNOLOGY
13.11.1 COMPANY SNAPSHOT
13.11.2 REVENUE ANALYSIS
13.11.3 SOLUTION PORTFOLIO
13.11.4 RECENT DEVELOPMENTS
13.12 IMAGE SOFT
13.12.1 COMPANY SNAPSHOT
13.12.2 PRODUCT PORTFOLIO
13.12.3 RECENT DEVELOPMENT
13.13 JAPAN MARINE SCIENCE INC.
13.13.1 COMPANY SNAPSHOT
13.13.2 PRODUCT PORTFOLIO
13.13.3 RECENT DEVELOPMENTS
13.14 KONGSBERG DIGITAL (A SUBSIDIARY OF KONGSBERG GRUPPEN)
13.14.1 COMPANY SNAPSHOT
13.14.2 REVENUE ANALYSIS
13.14.3 PRODUCTS PORTFOLIO
13.14.4 RECENT DEVELOPMENTS
13.15 PC MARITIME
13.15.1 COMPANY SNAPSHOT
13.15.2 SOLUTION PORTFOLIO
13.15.3 RECENT DEVELOPMENT
13.16 PIVOT MARITIME INTERNATIONAL
13.16.1 COMPANY SNAPSHOT
13.16.2 SOLUTION PORTFOLIO
13.16.3 RECENT DEVELOPMENTS
13.17 SIMWAVE B.V.
13.17.1 COMPANY SNAPSHOT
13.17.2 PRODUCT PORTFOLIO
13.17.3 RECENT DEVELOPMENT
13.18 SSPA
13.18.1 COMPANY SNAPSHOT
13.18.2 SOLUTION PORTFOLIO
13.18.3 RECENT DEVELOPMENT
13.19 ST ENGINEERING
13.19.1 COMPANY SNAPSHOT
13.19.2 REVENUE ANALYSIS
13.19.3 SOLUTION PORTFOLIO
13.19.4 RECENT DEVELOPMENTS
13.2 SYNERGY GROUP
13.20.1 COMPANY SNAPSHOT
13.20.2 SERVICE PORTFOLIO
13.20.3 RECENT DEVELOPMENTS
13.21 VIRTUAL MARINE, INC.
13.21.1 COMPANY SNAPSHOT
13.21.2 SOLUTION PORTFOLIO
13.21.3 RECENT DEVELOPMENTS
13.22 VSTEP BV
13.22.1 COMPANY SNAPSHOT
13.22.2 PRODUCT PORTFOLIO
13.22.3 RECENT DEVELOPMENT
14 QUESTIONNAIRE
15 RELATED REPORTS
List of Table
TABLE 1 EUROPE SHIP BRIDGE SIMULATORS MARKET, BY SOLUTION TYPE, 2020-2029 (USD MILLION)
TABLE 2 EUROPE LIVE TRAINING IN SHIP BRIDGE SIMULATORS MARKET, BY REGION, 2020-2029 (USD MILLION)
TABLE 3 EUROPE PROFESSIONAL TRAINING IN SHIP BRIDGE SIMULATORS MARKET, BY REGION, 2020-2029 (USD MILLION)
TABLE 4 EUROPE CONSTRUCTIVE TRAINING IN SHIP BRIDGE SIMULATORS MARKET, BY REGION, 2020-2029 (USD MILLION)
TABLE 5 EUROPE VIRTUAL TRAINING IN SHIP BRIDGE SIMULATORS MARKET, BY REGION, 2020-2029 (USD MILLION)
TABLE 6 EUROPE SYSTEM TRAINING IN SHIP BRIDGE SIMULATORS MARKET, BY REGION, 2020-2029 (USD MILLION)
TABLE 7 EUROPE GAME SIMULATION TRAINING IN SHIP BRIDGE SIMULATORS MARKET, BY REGION, 2020-2029 (USD MILLION)
TABLE 8 EUROPE SHIP BRIDGE SIMULATORS MARKET, BY TYPE, 2020-2029 (USD MILLION)
TABLE 9 EUROPE INTERACTIVE SHIP BRIDGE SIMULATORS IN SHIP BRIDGE SIMULATORS MARKET, BY REGION, 2020-2029 (USD MILLION)
TABLE 10 EUROPE NON-INTERACTIVE SHIP BRIDGE SIMULATORS IN SHIP BRIDGE SIMULATORS MARKET, BY REGION, 2020-2029 (USD MILLION)
TABLE 11 EUROPE SHIP BRIDGE SIMULATORS MARKET, BY ORGANIZATION SIZE, 2020-2029 (USD MILLION)
TABLE 12 EUROPE LARGE SCALE ORGANIZATIONS IN SHIP BRIDGE SIMULATORS MARKET, BY REGION, 2020-2029 (USD MILLION)
TABLE 13 EUROPE MEDIUM SCALE ORGANIZATIONS IN SHIP BRIDGE SIMULATORS MARKET, BY REGION, 2020-2029 (USD MILLION)
TABLE 14 EUROPE SMALL SCALE ORGANIZATIONS IN SHIP BRIDGE SIMULATORS MARKET, BY REGION, 2020-2029 (USD MILLION)
TABLE 15 EUROPE SHIP BRIDGE SIMULATORS MARKET, BY END-USE, 2020-2029 (USD MILLION)
TABLE 16 EUROPE MARINE IN SHIP BRIDGE SIMULATORS MARKET, BY REGION, 2020-2029 (USD MILLION)
TABLE 17 EUROPE MARINE IN SHIP BRIDGE SIMULATORS MARKET, BY SOLUTION TYPE, 2020-2029 (USD MILLION)
TABLE 18 EUROPE EDUCATIONAL IN SHIP BRIDGE SIMULATORS MARKET, BY REGION, 2020-2029 (USD MILLION)
TABLE 19 EUROPE EDUCATIONAL IN SHIP BRIDGE SIMULATORS MARKET, BY SOLUTION TYPE, 2020-2029 (USD MILLION)
TABLE 20 EUROPE SHIP BRIDGE SIMULATORS MARKET, BY COUNTRY, 2020-2029 (USD MILLION)
TABLE 21 EUROPE SHIP BRIDGE SIMULATORS MARKET, BY SOLUTION TYPE, 2020-2029 (USD MILLION)
TABLE 22 EUROPE SHIP BRIDGE SIMULATORS MARKET, BY TYPE, 2020-2029 (USD MILLION)
TABLE 23 EUROPE SHIP BRIDGE SIMULATORS MARKET, BY ORGANIZATION SIZE, 2020-2029 (USD MILLION)
TABLE 24 EUROPE SHIP BRIDGE SIMULATORS MARKET, BY END-USE, 2020-2029 (USD MILLION)
TABLE 25 EUROPE MARINE IN SHIP BRIDGE SIMULATORS MARKET, BY SOLUTION TYPE, 2020-2029 (USD MILLION)
TABLE 26 EUROPE EDUCATIONAL IN SHIP BRIDGE SIMULATORS MARKET, BY SOLUTION TYPE, 2020-2029 (USD MILLION)
TABLE 27 U.K. SHIP BRIDGE SIMULATORS MARKET, BY SOLUTION TYPE, 2020-2029 (USD MILLION)
TABLE 28 U.K. SHIP BRIDGE SIMULATORS MARKET, BY TYPE, 2020-2029 (USD MILLION)
TABLE 29 U.K. SHIP BRIDGE SIMULATORS MARKET, BY ORGANIZATION SIZE, 2020-2029 (USD MILLION)
TABLE 30 U.K. SHIP BRIDGE SIMULATORS MARKET, BY END-USE, 2020-2029 (USD MILLION)
TABLE 31 U.K. MARINE IN SHIP BRIDGE SIMULATORS MARKET, BY SOLUTION TYPE, 2020-2029 (USD MILLION)
TABLE 32 U.K. EDUCATIONAL IN SHIP BRIDGE SIMULATORS MARKET, BY SOLUTION TYPE, 2020-2029 (USD MILLION)
TABLE 33 GERMANY SHIP BRIDGE SIMULATORS MARKET, BY SOLUTION TYPE, 2020-2029 (USD MILLION)
TABLE 34 GERMANY SHIP BRIDGE SIMULATORS MARKET, BY TYPE, 2020-2029 (USD MILLION)
TABLE 35 GERMANY SHIP BRIDGE SIMULATORS MARKET, BY ORGANIZATION SIZE, 2020-2029 (USD MILLION)
TABLE 36 GERMANY SHIP BRIDGE SIMULATORS MARKET, BY END-USE, 2020-2029 (USD MILLION)
TABLE 37 GERMANY MARINE IN SHIP BRIDGE SIMULATORS MARKET, BY SOLUTION TYPE, 2020-2029 (USD MILLION)
TABLE 38 GERMANY EDUCATIONAL IN SHIP BRIDGE SIMULATORS MARKET, BY SOLUTION TYPE, 2020-2029 (USD MILLION)
TABLE 39 ITALY SHIP BRIDGE SIMULATORS MARKET, BY SOLUTION TYPE, 2020-2029 (USD MILLION)
TABLE 40 ITALY SHIP BRIDGE SIMULATORS MARKET, BY TYPE, 2020-2029 (USD MILLION)
TABLE 41 ITALY SHIP BRIDGE SIMULATORS MARKET, BY ORGANIZATION SIZE, 2020-2029 (USD MILLION)
TABLE 42 ITALY SHIP BRIDGE SIMULATORS MARKET, BY END-USE, 2020-2029 (USD MILLION)
TABLE 43 ITALY MARINE IN SHIP BRIDGE SIMULATORS MARKET, BY SOLUTION TYPE, 2020-2029 (USD MILLION)
TABLE 44 ITALY EDUCATIONAL IN SHIP BRIDGE SIMULATORS MARKET, BY SOLUTION TYPE, 2020-2029 (USD MILLION)
TABLE 45 FRANCE SHIP BRIDGE SIMULATORS MARKET, BY SOLUTION TYPE, 2020-2029 (USD MILLION)
TABLE 46 FRANCE SHIP BRIDGE SIMULATORS MARKET, BY TYPE, 2020-2029 (USD MILLION)
TABLE 47 FRANCE SHIP BRIDGE SIMULATORS MARKET, BY ORGANIZATION SIZE, 2020-2029 (USD MILLION)
TABLE 48 FRANCE SHIP BRIDGE SIMULATORS MARKET, BY END-USE, 2020-2029 (USD MILLION)
TABLE 49 FRANCE MARINE IN SHIP BRIDGE SIMULATORS MARKET, BY SOLUTION TYPE, 2020-2029 (USD MILLION)
TABLE 50 FRANCE EDUCATIONAL IN SHIP BRIDGE SIMULATORS MARKET, BY SOLUTION TYPE, 2020-2029 (USD MILLION)
TABLE 51 SPAIN SHIP BRIDGE SIMULATORS MARKET, BY SOLUTION TYPE, 2020-2029 (USD MILLION)
TABLE 52 SPAIN SHIP BRIDGE SIMULATORS MARKET, BY TYPE, 2020-2029 (USD MILLION)
TABLE 53 SPAIN SHIP BRIDGE SIMULATORS MARKET, BY ORGANIZATION SIZE, 2020-2029 (USD MILLION)
TABLE 54 SPAIN SHIP BRIDGE SIMULATORS MARKET, BY END-USE, 2020-2029 (USD MILLION)
TABLE 55 SPAIN MARINE IN SHIP BRIDGE SIMULATORS MARKET, BY SOLUTION TYPE, 2020-2029 (USD MILLION)
TABLE 56 SPAIN EDUCATIONAL IN SHIP BRIDGE SIMULATORS MARKET, BY SOLUTION TYPE, 2020-2029 (USD MILLION)
TABLE 57 TURKEY SHIP BRIDGE SIMULATORS MARKET, BY SOLUTION TYPE, 2020-2029 (USD MILLION)
TABLE 58 TURKEY SHIP BRIDGE SIMULATORS MARKET, BY TYPE, 2020-2029 (USD MILLION)
TABLE 59 TURKEY SHIP BRIDGE SIMULATORS MARKET, BY ORGANIZATION SIZE, 2020-2029 (USD MILLION)
TABLE 60 TURKEY SHIP BRIDGE SIMULATORS MARKET, BY END-USE, 2020-2029 (USD MILLION)
TABLE 61 TURKEY MARINE IN SHIP BRIDGE SIMULATORS MARKET, BY SOLUTION TYPE, 2020-2029 (USD MILLION)
TABLE 62 TURKEY EDUCATIONAL IN SHIP BRIDGE SIMULATORS MARKET, BY SOLUTION TYPE, 2020-2029 (USD MILLION)
TABLE 63 RUSSIA SHIP BRIDGE SIMULATORS MARKET, BY SOLUTION TYPE, 2020-2029 (USD MILLION)
TABLE 64 RUSSIA SHIP BRIDGE SIMULATORS MARKET, BY TYPE, 2020-2029 (USD MILLION)
TABLE 65 RUSSIA SHIP BRIDGE SIMULATORS MARKET, BY ORGANIZATION SIZE, 2020-2029 (USD MILLION)
TABLE 66 RUSSIA SHIP BRIDGE SIMULATORS MARKET, BY END-USE, 2020-2029 (USD MILLION)
TABLE 67 RUSSIA MARINE IN SHIP BRIDGE SIMULATORS MARKET, BY SOLUTION TYPE, 2020-2029 (USD MILLION)
TABLE 68 RUSSIA EDUCATIONAL IN SHIP BRIDGE SIMULATORS MARKET, BY SOLUTION TYPE, 2020-2029 (USD MILLION)
TABLE 69 NETHERLANDS SHIP BRIDGE SIMULATORS MARKET, BY SOLUTION TYPE, 2020-2029 (USD MILLION)
TABLE 70 NETHERLANDS SHIP BRIDGE SIMULATORS MARKET, BY TYPE, 2020-2029 (USD MILLION)
TABLE 71 NETHERLANDS SHIP BRIDGE SIMULATORS MARKET, BY ORGANIZATION SIZE, 2020-2029 (USD MILLION)
TABLE 72 NETHERLANDS SHIP BRIDGE SIMULATORS MARKET, BY END-USE, 2020-2029 (USD MILLION)
TABLE 73 NETHERLANDS MARINE IN SHIP BRIDGE SIMULATORS MARKET, BY SOLUTION TYPE, 2020-2029 (USD MILLION)
TABLE 74 NETHERLANDS EDUCATIONAL IN SHIP BRIDGE SIMULATORS MARKET, BY SOLUTION TYPE, 2020-2029 (USD MILLION)
TABLE 75 BELGIUM SHIP BRIDGE SIMULATORS MARKET, BY SOLUTION TYPE, 2020-2029 (USD MILLION)
TABLE 76 BELGIUM SHIP BRIDGE SIMULATORS MARKET, BY TYPE, 2020-2029 (USD MILLION)
TABLE 77 BELGIUM SHIP BRIDGE SIMULATORS MARKET, BY ORGANIZATION SIZE, 2020-2029 (USD MILLION)
TABLE 78 BELGIUM SHIP BRIDGE SIMULATORS MARKET, BY END-USE, 2020-2029 (USD MILLION)
TABLE 79 BELGIUM MARINE IN SHIP BRIDGE SIMULATORS MARKET, BY SOLUTION TYPE, 2020-2029 (USD MILLION)
TABLE 80 BELGIUM EDUCATIONAL IN SHIP BRIDGE SIMULATORS MARKET, BY SOLUTION TYPE, 2020-2029 (USD MILLION)
TABLE 81 SWITZERLAND SHIP BRIDGE SIMULATORS MARKET, BY SOLUTION TYPE, 2020-2029 (USD MILLION)
TABLE 82 SWITZERLAND SHIP BRIDGE SIMULATORS MARKET, BY TYPE, 2020-2029 (USD MILLION)
TABLE 83 SWITZERLAND SHIP BRIDGE SIMULATORS MARKET, BY ORGANIZATION SIZE, 2020-2029 (USD MILLION)
TABLE 84 SWITZERLAND SHIP BRIDGE SIMULATORS MARKET, BY END-USE, 2020-2029 (USD MILLION)
TABLE 85 SWITZERLAND MARINE IN SHIP BRIDGE SIMULATORS MARKET, BY SOLUTION TYPE, 2020-2029 (USD MILLION)
TABLE 86 SWITZERLAND EDUCATIONAL IN SHIP BRIDGE SIMULATORS MARKET, BY SOLUTION TYPE, 2020-2029 (USD MILLION)
TABLE 87 REST OF EUROPE SHIP BRIDGE SIMULATORS MARKET, BY SOLUTION TYPE, 2020-2029 (USD MILLION)
List of Figure
FIGURE 1 EUROPE SHIP BRIDGE SIMULATORS MARKET: SEGMENTATION
FIGURE 2 EUROPE SHIP BRIDGE SIMULATORS MARKET: DATA TRIANGULATION
FIGURE 3 EUROPE SHIP BRIDGE SIMULATORS MARKET: DROC ANALYSIS
FIGURE 4 EUROPE SHIP BRIDGE SIMULATORS MARKET: EUROPE VS REGIONAL MARKET ANALYSIS
FIGURE 5 EUROPE SHIP BRIDGE SIMULATORS MARKET: COMPANY RESEARCH ANALYSIS
FIGURE 6 EUROPE SHIP BRIDGE SIMULATORS MARKET: INTERVIEW DEMOGRAPHICS
FIGURE 7 EUROPE SHIP BRIDGE SIMULATORS MARKET: DBMR MARKET POSITION GRID
FIGURE 8 EUROPE SHIP BRIDGE SIMULATORS MARKET: VENDOR SHARE ANALYSIS
FIGURE 9 EUROPE SHIP BRIDGE SIMULATORS MARKET: SEGMENTATION
FIGURE 10 RISE IN THE NEED FOR EFFECTIVE TRAINING FOR MARINE OPERATIONS IS EXPECTED TO DRIVE THE EUROPE SHIP BRIDGE SIMULATORS MARKET IN THE FORECAST PERIOD OF 2022 TO 2029
FIGURE 11 LIVE TRAINING SEGMENT IS EXPECTED TO ACCOUNT FOR THE LARGEST SHARE OF EUROPE SHIP BRIDGE SIMULATORS MARKET IN 2022 & 2029
FIGURE 12 VALUE CHAIN ANALYSIS
FIGURE 13 DRIVERS, RESTRAINTS, OPPORTUNITIES, AND CHALLENGES OF THE EUROPE SHIP BRIDGE SIMULATORS MARKET
FIGURE 14 (2020-2025) – EUROPE ADOPTION RATE OF AUTOMATION IN INDUSTRIES
FIGURE 15 BENEFITS OF SIMULATION TECHNIQUE IN EDUCATION INDUSTRY
FIGURE 16 UNEMPLOYMENT RATE IN THE MIDDLE EAST & NORTH AFRICA REGION
FIGURE 17 EUROPE SHIP BRIDGE SIMULATORS MARKET: BY SOLUTION TYPE (2021)
FIGURE 18 EUROPE SHIP BRIDGE SIMULATORS MARKET: BY TYPE (2021)
FIGURE 19 EUROPE SHIP BRIDGE SIMULATORS MARKET: BY ORGANIZATION SIZE (2021)
FIGURE 20 EUROPE SHIP BRIDGE SIMULATORS MARKET: BY END-USE (2021)
FIGURE 21 EUROPE SHIP BRIDGE SIMULATORS MARKET: SNAPSHOT (2021)
FIGURE 22 EUROPE SHIP BRIDGE SIMULATORS MARKET: BY COUNTRY (2021)
FIGURE 23 EUROPE SHIP BRIDGE SIMULATORS MARKET: BY COUNTRY (2022 & 2029)
FIGURE 24 EUROPE SHIP BRIDGE SIMULATORS MARKET: BY COUNTRY (2021 & 2029)
FIGURE 25 EUROPE SHIP BRIDGE SIMULATORS MARKET: BY SOLUTION TYPE (2022-2029)
FIGURE 26 EUROPE SHIP BRIDGE SIMULATORS MARKET: COMPANY SHARE 2021 (%)
Data collection and base year analysis are done using data collection modules with large sample sizes. The stage includes obtaining market information or related data through various sources and strategies. It includes examining and planning all the data acquired from the past in advance. It likewise envelops the examination of information inconsistencies seen across different information sources. The market data is analysed and estimated using market statistical and coherent models. Also, market share analysis and key trend analysis are the major success factors in the market report. To know more, please request an analyst call or drop down your inquiry.
The key research methodology used by DBMR research team is data triangulation which involves data mining, analysis of the impact of data variables on the market and primary (industry expert) validation. Data models include Vendor Positioning Grid, Market Time Line Analysis, Market Overview and Guide, Company Positioning Grid, Patent Analysis, Pricing Analysis, Company Market Share Analysis, Standards of Measurement, Global versus Regional and Vendor Share Analysis. To know more about the research methodology, drop in an inquiry to speak to our industry experts.
Data Bridge Market Research is a leader in advanced formative research. We take pride in servicing our existing and new customers with data and analysis that match and suits their goal. The report can be customized to include price trend analysis of target brands understanding the market for additional countries (ask for the list of countries), clinical trial results data, literature review, refurbished market and product base analysis. Market analysis of target competitors can be analyzed from technology-based analysis to market portfolio strategies. We can add as many competitors that you require data about in the format and data style you are looking for. Our team of analysts can also provide you data in crude raw excel files pivot tables (Fact book) or can assist you in creating presentations from the data sets available in the report.


