
Europe Tahini Market
Market Size in USD Million
 USD
229.93 Million
USD
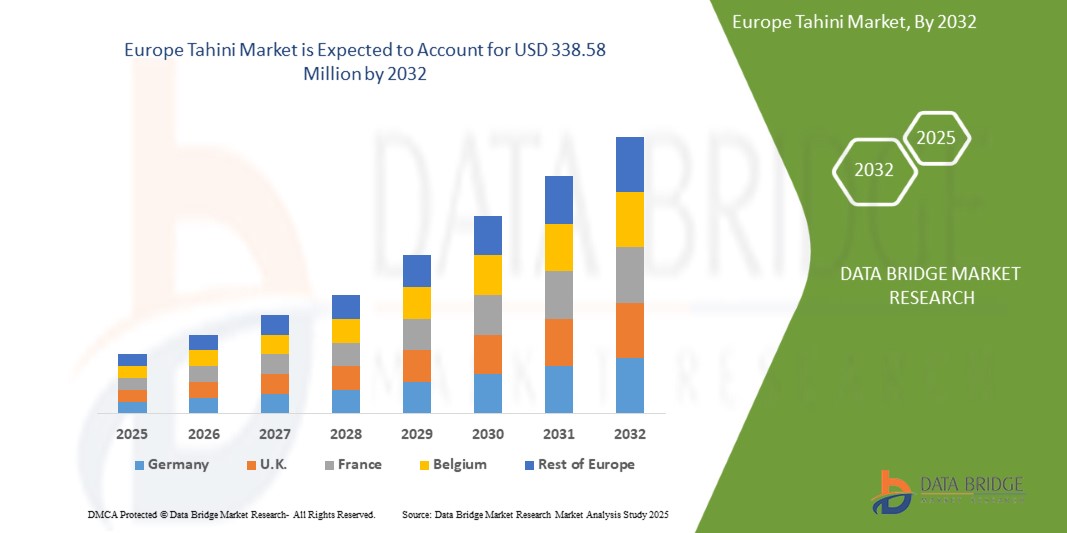
338.58 Million
2024
2032
USD
229.93 Million
USD
338.58 Million
2024
2032
| 2025 - 2032 | |
| USD 229.93 Million | |
| USD 338.58 Million | |
| % | |
Europe Tahini Market Analysis
Health benefits associated with the consumption of tahini and growing popularity of ethnic Arabic flavors and delicacies are expected to drive the demand for Europe tahini market. However, high pricing of products using tahini as an ingredient and side effects associated with consumption of sesame seeds may further restrict the market's growth.
Europe Tahini Market Size
Europe Tahini Market size was valued at USD 229.93 million in 2024 and is projected to reach USD 338.58 million by 2032, with a CAGR of 3.95% during the forecast period of 2025 to 2032.
Report Scope and Market Segmentation
|
Attributes |
Tahini Key Market Insights |
|
Segmentation |
|
|
Countries Covered |
Germany, Greece, U.K., Netherlands, Poland, France, Italy, Turkey, Russia, Spain, Belgium, Denmark, Switzerland, Sweden and Rest of Europe |
|
Key Market Players |
HAITOGLOU BROS S.A., Prince Tahina Ltd., Sesame & Tahina Food Industries Ltd., Meridian Foods Limited, Grecious, Beyda Gida San. Tic. A.S., Inci Food Industry, Dipasa Europe B.V., Tahini Royal, Shamir, Al'Fez, Skoulikas Bedford Ltd, TAMPICO TRADING GmbH, meletiadis.gr., EDN, Carleys, Citir Susam, MED CUISINE, Al Wadi Al Akhdar and BIONA among others. |
Europe Tahini Market Definition
Tahini, also called tahina, is a ground sesame paste that is traditionally used in Middle Eastern cuisines. It is made of mainly three ingredients: hulled sesame seeds, oil and sometimes salt. Sesame seeds form the basis of tahini; they can either be hulled or unhulled. Hulled sesame seeds are lighter in color and less bitter in taste. Unhulled sesame seeds can also be made into a paste, but it is darker and bitterer. It is made from sesame seeds soaked in water and then crushed to separate the bran from the kernels. It is a very versatile ingredient and can be used in both savory and sweet applications.
Tahini is relatively low in calories but high in fiber, protein and a variety of important vitamins such as vitamins E, B2, B1, B15, B3 and B5 and minerals such as iron, zinc and protein. It is especially a good source of copper and is also rich in selenium. Tahini has a positive effect on heart health by decreasing risk factors. It contains sesamol which is a natural compound and may protect against cancer.
Europe Tahini Market Dynamics
Drivers
- Health benefits associated with the consumption of tahini
Tahini has a presence of a long list of nutrients and offers several health benefits. It is full of healthy fats, vitamins and minerals. It has a relatively low amount of calories, but it is rich in fiber, protein and a variety of other important vitamins and minerals. It contains a high amount of protein than nuts and milk. Due to the presence of an impressive nutrient profile, tahini is linked with a variety of health benefits. The health benefits include improved heart wellness, reduced inflammation and potential cancer-fighting effects. It is a rich source of vitamin B, which boosts energy and brain function. The vitamin E present in tahini protects against various diseases such as stroke and heart diseases. It also acts as a source of important minerals such as iron, magnesium and calcium. Furthermore, the rising health consciousness among people and the rise in the demand for healthier products raises the demand for tahini-based products and thus is expected to drive the market’s demand.
- Growing popularity of ethnic Arabic flavors and delicacies
Europe has a flourishing demand for authentic Arabic and Mediterranean sesame-based products such as tahini. The rising popularity of such foods is due to the growing multiculturalism. The influence of different food cultures makes Europeans curious about different products from abroad. Food brands and restaurant owners adopt or copy these products with new flavors and culinary experiences. The mainstreaming of these ethnic foods and the increasing interest in vegan food contribute to the market's growth. Additionally, factors including globalization, changing standard of living, health and well-being and sustainability are the reasons for the phenomenal growth of flexible packaging in the last few years. This, in turn, increases the demand for tahini and is expected to drive the market’s growth.
- Increasing scope of adoption of sesame seeds in various food cuisines
Sesame seeds are a well-known ingredient across Europe and they are used across a wide variety of food items such as topping on bakery products such as bread, bagels and hamburger buns. They can be used to prepare snacks, crackers, confectionery and sweets. They are also used in various ethnic cuisines such as tahini, hummus, sushi and halva, among others. Health-conscious consumers use salads as seeds, dressings and sauces. Sesame seeds are not only used in several snack products, but different organic brands use them. It has high-value content in terms of calcium and protein and it has the potential to substitute both meat and dairy products. This has been reflected in developing various new food products such as sesame energy bars and sesame drinks. In conclusion, the ability of sesame seeds to be used as an ingredient in many food applications is expected to drive the market’s growth.
- Growth in the food service industry
Tahini is largely used as a food product in food service industry in the form of ingredients for various cuisines. The food service industry includes restaurants, hotels, cafes and catering services among others. Consumers are traveling across the world and are experiencing new foods and flavors. They are also interested in knowing the source and background of such dishes. The food service industry has undergone drastic developments in recent times. Growing demand for mobile food services such as food trucks and joints is penetrating the market. The number of fast-food chains and food outlets is also consistently increasing because of difficult working hours and busy lifestyles, which has created the demand for practical and easy options in terms of cuisines and services. Therefore, growth and development of food service industry is anticipated to drive the market’s growth.
Opportunities
- Innovation in food items in terms of ingredients and flavors
Tahini has gained attention as an essential component in hummus. It is an important ingredient in a wide variety of Middle Eastern dishes. The products find opportunities as chefs and consumers discover new ways to use the condiment in various products such as salads, sandwiches and fish fillets among others. It is mixed with cocoa and orange, enhanced through probiotics and served with honey and sesame sticks to appeal to a wider customer base. Various factors such as internet penetration, the rise in smartphone users and social media influence among others, have given a boost to the e-commerce sector. The widespread use of e-grocery and delivery service platforms has recently contributed to substantial growth in the online buying and selling of foods. Furthermore, new lifestyles, higher disposable incomes and consumer awareness create demand for diverse and innovative food products. This is projected to provide new growth opportunities to the market.
- Increasing demand for organic and nutrient-rich products
Organic food products have become one of the most prominent factors influencing consumers' buying decisions. Consumers prefer healthy and organic food products. The demand for organically sourced food items is consistently growing. Therefore, tahini producers and suppliers need to offer organic products. The increasing concerns about the presence of chemicals in conventionally sourced food have increased the demand for organic products. Moreover, the increasing demand for organic and nutrient-rich food products due to their various health benefits and increasing awareness among consumers about other positive effects of organic foods will further provide growth opportunities to the market. Also, the rise in willingness of consumers to pay more for such products, along with government policy support, may provide new growth opportunities to the market.
Restraints/Challenges
- High pricing of products using tahini as an ingredient
Tahini is a paste made from ground sesame seeds and contains a very high amount of oil content. It is a key ingredient in various dishes such as hummus, baba ghanoush and dipping sauces among others. It is highly nutritious and calorific food and is bound to have many vitamins and minerals. Most sesame seeds are grown in labor-intensive environments, so the cultivation costs are high. Sesame seeds are imported to Europe from other countries. The demand for these seeds is based on different types and qualities. Apart from high costs of tahini products, the regulatory environment is a major factor that can restrict the market's growth. Therefore, the high pricing of tahini-based products and the stringent rules and regulations may hinder the market’s growth.
- Side effects associated with the consumption of sesame seeds
Although, tahini has several nutritional benefits, there are some side effects to consider as well. Since sesame is a rich oil source, the seeds have an oily-smooth consistency when grounded as a paste. Sesame seeds should always be consumed in moderation. Excessive consumption can lead to bowel and colon irritation. In some cases, they may also trigger allergies. Anaphylaxis is a side effect when the immune system releases high levels of certain chemicals. These chemicals induce an anaphylactic shock which lowers the blood pressure and obstructs the breathing process. Sesame allergy may cause nausea, vomiting, abdominal pain, hives, itchy mouth and cough. Sesame seeds are food allergens that can cause mild to severe health issues. Therefore, high omega-6 polyunsaturated fat content, risks from sesame allergy and indigestion may hamper the market’s growth.
- Adulteration in tahini products
Adulteration is adding harmful or deleterious substances to tahini to increase its quantity and profit. These adulterated tahini food products are harmful to the health of consumers. The adulteration of tahini has been common in food industry. In some cases, the sesame paste is made in small workshops, especially where management ability and operating capital are low. In order to reduce the costs of production, often low-quality raw materials are used and other oil crops such as peanuts and maize are added. In many cases, food additives are also used to improve the aroma of sesame paste because of the poor quality of sesame used. Thus, the adulteration done by the manufacturers of tahini products to increase their sales by using low-quality ingredients, which affects the health of the consumers, is expected to challenge the market’s growth.
- Intense competition in the market
The profitability of tahini industry has been favorable therefore, new companies want to grab the benefits of the industry. Companies within the industry are expected to grow even more, creating high market competition. They are increasingly implementing new technologies such as Artificial Intelligence (AI) to effectively manage the procurement, production and distribution of tahini products. Also, they are exploring mergers and acquisitions to acquire new technologies and expand to new geographies. Companies design the products in attractive packaging and variable quantities and showcase their products on various online platforms and retail channels such as supermarkets, hypermarkets and convenience stores. Thus, the presence of many players is expected to challenge the new entrants and intensify the competition in the market.
Europe Tahini Market Scope
Europe tahini market is segmented into eight notable segments based on product type, source, nature, category, color, packaging type, claim and end-user. The growth amongst these segments will help you analyze major growth segments in the industries and provide the users with a valuable market overview and market insights to help them make strategic decisions for identifying core market applications.
Product Type
- Paste/Pure Tahini
- Seasoned Tahini
- Others
Source
- Hulled Sesame
- Dehulled Sesame
Nature
- Conventional/Inorganic
- Organic
Category
- GMO
- Non-GMO
Color
- White
- Black
Packaging Type
- Bottles
- Tubs
- Sachets
- Jars
- Tins
- Drum/Bucket
- Others
Claim
- Dairy Free
- Fat Free
- Nut Free
- Soy Free
- Gluten Free
- Preservative Free
- Non-GMO
- Vegan
- With All Above Claims
- Regular (No Claims)
End-User
- Domestic/Household
- Food Service Sector
- Food Industry
- Others
Europe Tahini Market Regional Analysis
Europe tahini market is analyzed and market size insights and trends are provided by product type, source, nature, category, color, packaging type, claim and end-user as referenced above.
Europe tahini market covers countries such as Germany, Greece, U.K., Netherlands, Poland, France, Italy, Turkey, Russia, Spain, Belgium, Denmark, Switzerland, Sweden and Rest of Europe.
Germany is expected to dominate the market due to strong demand increase as people mostly use tahini products in the form of dressings or are health conscious. Moreover, producers did many partnerships, participations, events, collaborations and activities with local companies as well as international players to create more awareness about the benefits of tahini products.
The country section of this market report also provides individual market impacting factors and domestic regulation changes that impact the market's current and future trends. Data points such as new sales, replacement sales, country demographics, disease epidemiology and import-export tariffs are some of the significant pointers used to forecast the market scenario for individual countries. Also, the presence and availability of European brands and their challenges faced due to large or scarce competition from local and domestic brands and the impact of sales channels are considered while providing forecast analysis of the country data.
Tahini Market Share
Europe tahini market competitive landscape provides details of the competitor. Details included are company overview, company financials, revenue generated, market potential, investment in research and development, new market initiatives, global presence, production sites and facilities, production capacities, company strengths and weaknesses, solution launch, product width and breadth, application dominance. The above data points are only related to the companies' focus on the Europe tahini market.
Tahini Market Leaders Operating in the Market Are:
- HAITOGLOU BROS S.A.
- Prince Tahina Ltd.
- Sesame & Tahina Food Industries Ltd.
- Meridian Foods Limited
- Grecious
- Beyda Gida San. Tic. A.S.
- Inci Food Industry
- Dipasa Europe B.V.
- Tahini Royal
- Shamir
- Al'Fez
- Skoulikas Bedford Ltd
- TAMPICO TRADING GmbH
- meletiadis.gr.
- EDN
- Carleys
- Citir Susam
- MED CUISINE
- Al Wadi Al Akhdar
- BIONA
Latest Developments in Tahini Market
- In October 2021, Meridian Foods Limited launched The Deforesters Arms to highlight the threat of deforestation. The event was hosted by their orangutan ambassador, Pongo. They showcased their palm oil-free products and the benefits of using such products. This will help the company to connect with environment-conscious consumers and show their sustainability initiatives.
- In August 2020, Tahini Royal received an audit certificate from SALSA, a robust and effective food safety certification scheme appropriate for food producers and suppliers. It is granted to suppliers who can demonstrate to an auditor that they can produce and supply safe and legal food and are committed to continually meeting the requirements of the SALSA standard. This certification has demonstrated that the company complies with satisfactory standards for tahini manufacturing.
SKU-

- Interactive Data Analysis Dashboard
- Company Analysis Dashboard for high growth potential opportunities
- Research Analyst Access for customization & queries
- Competitor Analysis with Interactive dashboard
- Latest News, Updates & Trend analysis
- Harness the Power of Benchmark Analysis for Comprehensive Competitor Tracking
Europe Tahini Market, Supply Chain Analysis and Ecosystem Framework
To support market growth and help clients navigate the impact of geopolitical shifts, DBMR has integrated in-depth supply chain analysis into its Europe Tahini Market research reports. This addition empowers clients to respond effectively to global changes affecting their industries. The supply chain analysis section includes detailed insights such as Europe Tahini Market consumption and production by country, price trend analysis, the impact of tariffs and geopolitical developments, and import and export trends by country and HSN code. It also highlights major suppliers with data on production capacity and company profiles, as well as key importers and exporters. In addition to research, DBMR offers specialized supply chain consulting services backed by over a decade of experience, providing solutions like supplier discovery, supplier risk assessment, price trend analysis, impact evaluation of inflation and trade route changes, and comprehensive market trend analysis.
Data collection and base year analysis are done using data collection modules with large sample sizes. The stage includes obtaining market information or related data through various sources and strategies. It includes examining and planning all the data acquired from the past in advance. It likewise envelops the examination of information inconsistencies seen across different information sources. The market data is analysed and estimated using market statistical and coherent models. Also, market share analysis and key trend analysis are the major success factors in the market report. To know more, please request an analyst call or drop down your inquiry.
The key research methodology used by DBMR research team is data triangulation which involves data mining, analysis of the impact of data variables on the market and primary (industry expert) validation. Data models include Vendor Positioning Grid, Market Time Line Analysis, Market Overview and Guide, Company Positioning Grid, Patent Analysis, Pricing Analysis, Company Market Share Analysis, Standards of Measurement, Global versus Regional and Vendor Share Analysis. To know more about the research methodology, drop in an inquiry to speak to our industry experts.
Data Bridge Market Research is a leader in advanced formative research. We take pride in servicing our existing and new customers with data and analysis that match and suits their goal. The report can be customized to include price trend analysis of target brands understanding the market for additional countries (ask for the list of countries), clinical trial results data, literature review, refurbished market and product base analysis. Market analysis of target competitors can be analyzed from technology-based analysis to market portfolio strategies. We can add as many competitors that you require data about in the format and data style you are looking for. Our team of analysts can also provide you data in crude raw excel files pivot tables (Fact book) or can assist you in creating presentations from the data sets available in the report.


