
Global Lentiviral Vector Market
Market Size in USD Million
 USD
12.89 Million
USD
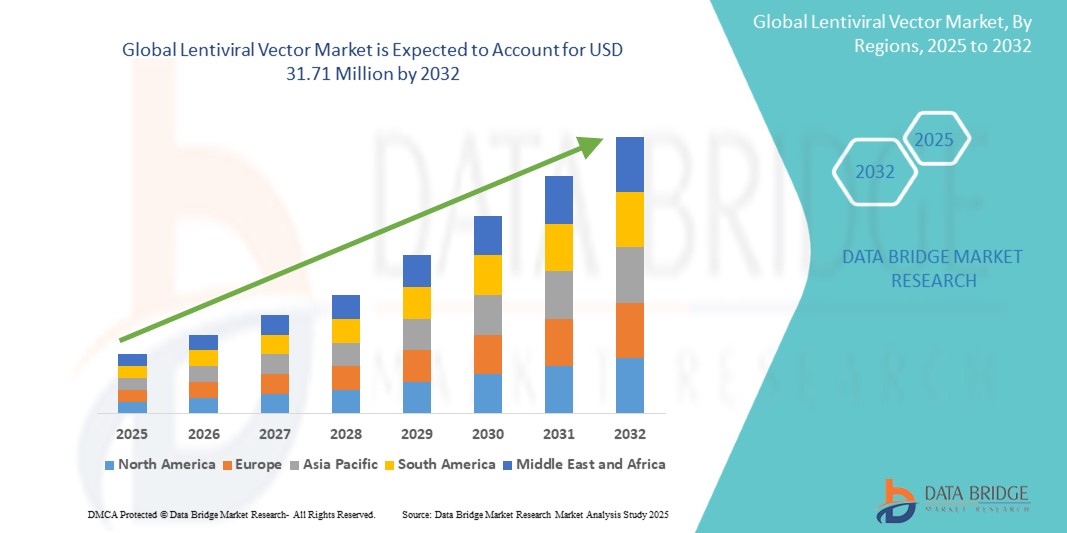
31.71 Million
2024
2032
USD
12.89 Million
USD
31.71 Million
2024
2032
| 2025 - 2032 | |
| USD 12.89 Million | |
| USD 31.71 Million | |
| % | |
|
Lentiviral Vector Market Size
- The global Lentiviral Vector market was valued at USD 12.89 million in 2024 and is expected to reach USD 31.71 million by 2032
- During the forecast period of 2025 to 2032 the market is likely to grow at a CAGR of 11.90%, primarily driven by the rising demand for gene and cell therapies, especially in the treatment of cancer and genetic disorders
- This growth is driven by factors such as the increasing investments in gene therapy research, advancements in vector engineering, and the growing number of clinical trials utilizing lentiviral vectors
Lentiviral Vector Market Analysis
- Lentiviral vectors are essential tools in gene therapy and cell-based treatments, used to deliver genetic material into cells for long-term expression. They are widely applied in therapies targeting cancer, genetic disorders, and infectious diseases
- The demand for lentiviral vectors is significantly driven by the growing adoption of gene and cell therapies, increasing clinical trial activity, and favorable regulatory support. Their ability to stably integrate into both dividing and non-dividing cells makes them highly desirable for durable therapeutic outcomes
- North America stands out as one of the dominant regions for lentiviral vector development, driven by strong biotechnology research, supportive regulatory frameworks, and increasing investments in advanced therapies
- For instance, the U.S. leads in FDA-approved gene therapies utilizing lentiviral vectors, with numerous biotech firms and academic institutions contributing to innovation and large-scale vector production
- Globally, lentiviral vectors rank as one of the most critical delivery systems in the gene therapy landscape, playing a pivotal role in enabling next-generation treatments and personalized medicine approaches
Report Scope and Lentiviral Vector Market Segmentation
|
Attributes |
Lentiviral Vector Key Market Insights |
|
Segments Covered |
|
|
Countries Covered |
North America
Europe
Asia-Pacific
Middle East and Africa
South America
|
|
Key Market Players |
|
|
Market Opportunities |
|
|
Value Added Data Infosets |
In addition to the insights on market scenarios such as market value, growth rate, segmentation, geographical coverage, and major players, the market reports curated by the Data Bridge Market Research also include import export analysis, production capacity overview, production consumption analysis, price trend analysis, climate change scenario, supply chain analysis, value chain analysis, raw material/consumables overview, vendor selection criteria, PESTLE Analysis, Porter Analysis, and regulatory framework. |
Lentiviral Vector Market Trends
“Rising Focus on Scalable Manufacturing and Automation”
- One prominent trend in the global lentiviral vector market is the increasing focus on scalable manufacturing processes and automation technologies
- TAs demand for gene therapies grows, manufacturers are investing in advanced bioprocessing solutions to produce high-quality lentiviral vectors at larger scales, ensuring consistent yield and regulatory compliance
- For instance, companies are adopting automated, closed-system platforms for upstream and downstream processing, which enhance production efficiency, reduce contamination risk, and support cGMP standards necessary for clinical and commercial supply
- This trend is also driven by the need to reduce production costs and accelerate time-to-market for gene therapies, prompting strategic partnerships between biotech firms and CDMOs (Contract Development and Manufacturing Organizations)
- Overall, the shift toward scalable and automated manufacturing is transforming the lentiviral vector landscape, enabling broader accessibility of gene therapies and supporting market growth
Lentiviral Vector Market Dynamics
Driver
“Surging Demand for Gene and Cell Therapies”
- The increasing demand for gene and cell therapies is a major driver for the lentiviral vector market, as these vectors play a vital role in delivering therapeutic genes into target cells with long-term expression
- The rise in genetic disorders, rare diseases, and cancers requiring precision treatment has led to a surge in clinical trials and commercial applications utilizing lentiviral vectors for their stable and efficient gene delivery capabilities
- Lentiviral vectors are particularly favored due to their ability to transduce both dividing and non-dividing cells, making them highly versatile for ex vivo and in vivo gene therapy applications, including CAR-T cell therapy
- The expanding pipeline of gene therapies and the growing number of regulatory approvals for lentiviral-based products are also propelling the market forward, driving increased investments in vector development and manufacturing technologies
- As the biotech and pharmaceutical industries continue to focus on personalized medicine, the demand for safe and effective viral vectors such as lentiviruses is expected to rise significantly
For instance,
- In August 2022, the FDA approved Zynteglo, a lentiviral vector-based gene therapy for beta-thalassemia, marking a significant milestone in the commercialization of these vectors and highlighting their clinical relevance
- In October 2021, bluebird bio announced positive outcomes from clinical trials using lentiviral vectors for sickle cell disease and beta-thalassemia, reinforcing the growing confidence and momentum behind lentiviral technologies
- As gene and cell therapies gain traction globally, lentiviral vectors remain at the forefront of innovation, driving robust growth and investment in the market
Opportunity
“Emerging Potential of Artificial Intelligence in Vector Design and Manufacturing”
- The integration of artificial intelligence (AI) in the design and manufacturing of lentiviral vectors presents a transformative opportunity to enhance vector efficacy, safety, and production efficiency
- AI algorithms can accelerate the identification of optimal vector constructs by analyzing vast datasets on gene expression, promoter activity, and vector-host interactions, thus streamlining vector customization for specific therapeutic applications
- In addition, AI-powered systems can optimize bioprocessing workflows by predicting yields, identifying process bottlenecks, and enabling real-time monitoring and quality control during vector manufacturing
For instance,
- In October 2023, a study published in Nature Biotechnology demonstrated the use of AI models to predict lentiviral vector titers and stability, leading to more efficient scale-up and production planning for clinical and commercial batches
- In May 2024, several biotech firms began deploying machine learning platforms for in silico screening of vector elements—such as promoters and enhancers—to reduce trial-and-error experimentation and accelerate regulatory approval pathways
- By harnessing AI technologies, companies can significantly reduce development timelines, minimize manufacturing costs, and improve the safety profiles of lentiviral vectors—paving the way for faster and more accessible gene therapy solutions
Restraint/Challenge
“High Manufacturing Costs and Complex Regulatory Requirements”
- The high cost and complexity associated with the manufacturing of lentiviral vectors present a significant challenge for market expansion, especially for smaller biotech firms and research institutions
- The production involves intricate processes such as cell culture, vector purification, and strict adherence to cGMP standards, often requiring specialized facilities and skilled personnel—factors that contribute to elevated operational expenses
- In addition, navigating the stringent regulatory pathways for gene therapy products, including the need for extensive safety, efficacy, and quality testing, can delay product development and increase financial risk
For instance,
- In September 2023, a report published by BioProcess International highlighted that manufacturing lentiviral vectors can cost between USD 50,000 and USD 500,000 per batch, depending on scale and purity requirements—posing a financial barrier to commercialization
- In December 2024, according to a whitepaper by Alliance for Regenerative Medicine, companies cited regulatory uncertainty and varying global standards as key hurdles to efficient market entry, often requiring multiple rounds of documentation and clinical validation
- Consequently, these high costs and regulatory burdens can limit innovation, restrict access in low-resource settings, and slow the adoption of lentiviral-based therapies—ultimately posing a restraint to the market’s long-term growth potential
Lentiviral Vector Market Scope
The market is segmented on the basis of component, type, generation, delivery method, workflow, disease indication, application, and end user
|
Segmentation |
Sub-Segmentation |
|
By Component |
|
|
By Type |
|
|
By Generation |
|
|
By Delivery method |
|
|
By Workflow |
|
|
By Disease Indication |
|
|
By Application |
|
|
By End User |
|
Lentiviral Vector Market Regional Analysis
“North America is the Dominant Region in the Lentiviral Vector Market”
- North America dominates the lentiviral vector market, attributed to its robust biotechnology and pharmaceutical industries, well-established research infrastructure, and strong regulatory support for gene and cell therapies
- U.S. holds a substantial market share due to the high number of ongoing clinical trials, increasing FDA approvals for gene therapies utilizing lentiviral vectors, and significant investments from both public and private sectors in regenerative medicine
- The Leading biotech companies and contract development and manufacturing organizations (CDMOs) based in the region are continuously innovating and expanding manufacturing capabilities to meet rising global demand
- In addition, the presence of academic research institutions, supportive funding environments, and collaborative industry initiatives further enhance North America’s leadership in the development and commercialization of lentiviral vector-based therapies
“Asia-Pacific is Projected to Register the Highest Growth Rate”
- Asia-Pacific is expected to witness the highest growth rate in the lentiviral vector market, fueled by increasing government support for gene therapy research, expanding biomanufacturing capabilities, and rising prevalence of genetic and chronic diseases
- Countries such as China, Japan, and South Korea are emerging as significant players, driven by strong Research and Development pipelines, supportive regulatory reforms, and growing participation in international clinical trials
- Japan remains at the forefront in Asia for regulatory innovation and early adoption of gene therapies, supported by a well-developed healthcare system and advanced research facilities
- China and India are rapidly scaling up their biotech sectors, with increased investments in viral vector production, local development of gene therapy products, and the entry of global gene therapy companies into their markets. Improved infrastructure and growing public awareness are also accelerating the adoption of advanced therapies across the region
Lentiviral Vector Market Share
The market competitive landscape provides details by competitor. Details included are company overview, company financials, revenue generated, market potential, investment in research and development, new market initiatives, global presence, production sites and facilities, production capacities, company strengths and weaknesses, product launch, product width and breadth, application dominance. The above data points provided are only related to the companies' focus related to market.
The Major Market Leaders Operating in the Market Are:
- Charles River Laboratories (U.K.)
- Merck KGaA (Germany)
- FinVector Oy (Finland)
- Oxford Biomedica PLC (U.K.)
- OriGene Technologies, Inc. (U.S.)
- Sino Biological Inc. (China)
- Cell Biolabs, Inc. (U.S.)
- Batavia Biosciences B.V. (The Netherlands)
- Lonza (Switzerland)
- GENEMEDI (China)
- Takara Bio Inc. (Japan)
- Thermo Fisher Scientific Inc. (U.S.)
- Waisman Biomanufacturing (U.S.)
- Cytiva (U.S.)
- Charles River Laboratories (U.S.)
- VIVEbiotech (Spain)
- Andelyn Biosciences (U.S.)
- Catalent, Inc. (U.S.)
- GenScript (U.S.)
- uniQure NV (The Netherlands)
Latest Developments in Global Lentiviral Vector Market
- In June 2024, Charles River Laboratories announced a strategic collaboration with the Gates Institute at the University of Colorado Anschutz Medical Campus to enhance lentiviral vector production, aiming to advance gene therapy research and development
- In May 2024, Donaldson Company, Inc. revealed the development of an integrated lentiviral vector manufacturing platform through its subsidiaries, Isolere Bio and Univercells Technologies, focusing on improving production efficiency and scalability
- In September 2024, Rentschler Biopharma introduced a new lentiviral vector manufacturing toolbox at its Stevenage, UK site, expanding its service offerings to support advanced therapy developers with process development and cGMP manufacturing services
- In December 2024, VIVEbiotech secured growth equity investment from Ampersand Capital Partners to expand its lentiviral vector manufacturing capabilities in San Sebastián, Spain, supporting a robust pipeline of gene therapy projects
- In June 2024, Rocket Pharmaceuticals announced that the U.S. FDA declined to approve its gene therapy, Kresladi, for treating severe Leukocyte Adhesion Deficiency-I, requesting additional information to complete its review
SKU-

- Interactive Data Analysis Dashboard
- Company Analysis Dashboard for high growth potential opportunities
- Research Analyst Access for customization & queries
- Competitor Analysis with Interactive dashboard
- Latest News, Updates & Trend analysis
- Harness the Power of Benchmark Analysis for Comprehensive Competitor Tracking
Data collection and base year analysis are done using data collection modules with large sample sizes. The stage includes obtaining market information or related data through various sources and strategies. It includes examining and planning all the data acquired from the past in advance. It likewise envelops the examination of information inconsistencies seen across different information sources. The market data is analysed and estimated using market statistical and coherent models. Also, market share analysis and key trend analysis are the major success factors in the market report. To know more, please request an analyst call or drop down your inquiry.
The key research methodology used by DBMR research team is data triangulation which involves data mining, analysis of the impact of data variables on the market and primary (industry expert) validation. Data models include Vendor Positioning Grid, Market Time Line Analysis, Market Overview and Guide, Company Positioning Grid, Patent Analysis, Pricing Analysis, Company Market Share Analysis, Standards of Measurement, Global versus Regional and Vendor Share Analysis. To know more about the research methodology, drop in an inquiry to speak to our industry experts.
Data Bridge Market Research is a leader in advanced formative research. We take pride in servicing our existing and new customers with data and analysis that match and suits their goal. The report can be customized to include price trend analysis of target brands understanding the market for additional countries (ask for the list of countries), clinical trial results data, literature review, refurbished market and product base analysis. Market analysis of target competitors can be analyzed from technology-based analysis to market portfolio strategies. We can add as many competitors that you require data about in the format and data style you are looking for. Our team of analysts can also provide you data in crude raw excel files pivot tables (Fact book) or can assist you in creating presentations from the data sets available in the report.


