
Global Flavored Water Market
Market Size in USD Billion
 USD
15.80 Billion
USD
21.40 Billion
2024
2032
USD
15.80 Billion
USD
21.40 Billion
2024
2032
| 2025 - 2032 | |
| USD 15.80 Billion | |
| USD 21.40 Billion | |
| % | |
|
Flavored Water Market Size
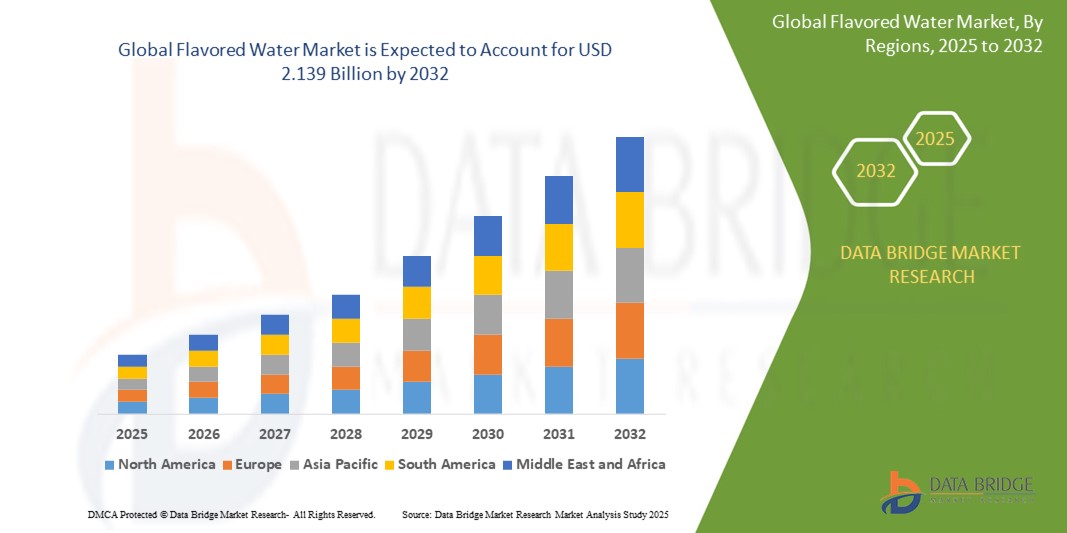
- The Global Flavored Water Market was valued at USD 15.80 billion in 2024 and is expected to reach USD 2.139 billion by 2032
- During the forecast period of 2025 to 2032 the market is likely to grow at a CAGR of 12.40%, primarily driven by the increasing consumer preference for healthier, low-calorie beverage alternatives to sugary sodas and juices
- This growth is fueled by factors such as the rising health consciousness among consumers, innovations in flavor combinations, and the increasing demand for functional beverages that offer hydration along with added health benefits like vitamins and electrolytes
Flavored Water Market Analysis
- Flavored water is gaining significant traction as a healthier alternative to sugary beverages, offering refreshing hydration with natural flavors, often without added sugars, preservatives, or artificial ingredients. This makes it especially appealing to health-conscious consumers seeking low-calorie drink options
- The demand for flavored water is driven by factors such as the increasing preference for functional beverages, the rising health awareness among consumers, and the growing concerns over the negative health impacts of sugary drinks. Many flavored waters now offer added health benefits like vitamins, electrolytes, or antioxidants, making them an attractive choice for wellness-focused consumers
- The North America region stands out as one of the dominant markets for flavored water, driven by strong consumer demand, innovative product offerings, and the region’s growing focus on healthy living
- For instance, the flavored water market in the U.S. has seen a surge in popularity, with consumers increasingly choosing flavored water over traditional sodas and sugary drinks due to its health benefits. Major brands like Hint Water, Spindrift, and LaCroix have contributed significantly to the market’s growth
- Globally, flavored water is becoming an essential category within the broader beverage market, especially in the wake of rising health trends and a shift towards natural and functional beverages. Its versatility and appeal across age groups—particularly among millennials and Generation Z—are key drivers in expanding the market share
Report Scope and Flavored Water Market Segmentation
|
Attributes |
Flavored Water Key Market Insights |
|
Segments Covered |
|
|
Countries Covered |
North America
Europe
Asia-Pacific
Middle East and Africa
South America
|
|
Key Market Players |
|
|
Market Opportunities |
|
|
Value Added Data Infosets |
In addition to the insights on market scenarios such as market value, growth rate, segmentation, geographical coverage, and major players, the market reports curated by the Data Bridge Market Research also include import export analysis, production capacity overview, production consumption analysis, price trend analysis, climate change scenario, supply chain analysis, value chain analysis, raw material/consumables overview, vendor selection criteria, PESTLE Analysis, Porter Analysis, and regulatory framework. |
Flavored Water Market Trends
“Rising Popularity of Functional and Infused Flavored Waters”
- One prominent trend in the global flavored water market is the growing popularity of functional and infused flavored waters. Consumers are increasingly seeking beverages that offer both hydration and health benefits, driving the demand for flavored waters that contain added nutrients like vitamins, electrolytes, and antioxidants
- These functional flavored waters cater to a variety of needs, from boosting energy and metabolism to supporting skin health and immune function
- For instance, beverages infused with ingredients like vitamin C, collagen, or electrolytes are gaining traction, especially among health-conscious consumers and fitness enthusiasts. These products help consumers stay hydrated while providing an added layer of wellness benefits
- Natural ingredients are also a growing trend, with brands focusing on clean labels and natural flavors from fruits, herbs, and botanicals, further enhancing their appeal
- Infused waters with flavors like cucumber-mint, lemon-ginger, and berry-lavender are increasingly popular, offering consumers a refreshing, low-calorie alternative to sugary drinks
- This trend is reshaping the beverage market, driving the introduction of innovative new products and expanding the flavored water category to new consumer segments, particularly in the millennial and Gen Z demographics
Flavored Water Market Dynamics
Driver
“Growing Demand Due to Increasing Health Consciousness”
- The rising awareness about the importance of healthy hydration is significantly driving the demand for flavored water as a healthier alternative to sugary drinks and sodas
- As consumers become more health-conscious and seek better options to stay hydrated, flavored water is gaining popularity due to its low calorie, sugar-free, and refreshing qualities
- Flavored water is seen as an ideal option for individuals who are looking to reduce sugar intake but still enjoy a variety of tastes, making it appealing to a wide range of age groups and demographics
- The increasing trend towards fitness and wellness further fuels the demand, as flavored water is often marketed as a suitable beverage for active individuals, helping them stay hydrated while providing a refreshing taste
- With the growing availability of diverse flavors, natural ingredients, and functional benefits such as added electrolytes, vitamins, and minerals, flavored water continues to attract a broad consumer base
For instance,
- In March 2023, Nestlé Waters (now part of Nestlé Health Science) launched a new line of flavored waters under its Poland Spring brand in the U.S., expanding their portfolio to meet the growing consumer demand for low-calorie, sugar-free hydration options. The new products feature natural flavors and are marketed as a healthy hydration solution, aligning with the increasing trend towards wellness
- In September 2022, Coca-Cola introduced a new flavor of its Smartwater brand, offering a mix of electrolytes and a refreshing taste, catering to health-conscious consumers looking for functional beverages that support hydration and wellness. This move is in line with the growing market demand for flavored water as an alternative to sugary drinks
- As companies like Nestlé, Coca-Cola, and PepsiCo introduce new flavored water products, it highlights the increasing consumer demand for healthy hydration options and the growing market for these beverages globally
Opportunity
“Expansion of Functional Ingredients and Health Benefits”
- The incorporation of functional ingredients into flavored water products, such as electrolytes, vitamins, minerals, and adaptogens, is creating new opportunities for product differentiation and market growth
- As consumers become more health-conscious, they are increasingly seeking beverages that offer additional health benefits, beyond basic hydration. Flavored water products enriched with ingredients that promote wellness, energy, immunity, and digestive health are gaining popularity
- Functional flavored waters, such as those infused with collagen for skin health, or with prebiotics for digestive support, present opportunities for brands to capture the growing demand for beverages that align with holistic health trends
- The increasing interest in natural and plant-based ingredients further supports this trend, as consumers prefer products with clean labels, free from artificial additives and preservatives
For instance,
- In August 2024, SodaStream introduced a new line of flavored water syrups containing added electrolytes and vitamins, designed to enhance hydration and provide energy benefits. This innovation was aimed at tapping into the growing demand for functional beverages, offering consumers a healthier alternative to sugary sodas
- In June 2023, Nestlé Waters launched a new range of flavored waters under the Nestlé Pure Life brand that incorporates plant-based ingredients like aloe vera and green tea extracts. These products were designed to appeal to health-conscious consumers looking for functional beverages that support digestion and overall wellness
- In February 2023, Spindrift expanded its product offerings by launching a new series of sparkling waters with added electrolytes, targeting the growing wellness and fitness markets. This line of beverages is marketed as a refreshing post-workout hydration option, capitalizing on the increasing demand for beverages that support an active lifestyle
- As companies integrate functional ingredients into flavored water, there is a significant opportunity to cater to the expanding health and wellness trend, meeting consumer needs for beverages that not only refresh but also support their overall health goals
Restraint/Challenge
“High Production Costs and Pricing Pressures”
- The cost of producing flavored water, especially when incorporating premium ingredients such as organic flavors, natural sweeteners, and functional additives, can be high. This puts pressure on manufacturers to maintain competitive pricing while ensuring product quality and profitability
- The use of specialized packaging, such as eco-friendly bottles or cans, adds to production costs, further elevating the overall cost structure for companies in the flavored water industry. These increased costs can make it difficult for companies to offer products at affordable price points, especially in price-sensitive markets
- As flavored water continues to grow in popularity, there is growing competition in the market, with many brands offering similar products. This intensifies pricing pressure, making it challenging for companies to balance costs with profitability, especially in regions with strong cost sensitivity
For instance,
- In April 2024, PepsiCo reported in their quarterly earnings that production costs for their Bubly flavored water brand had increased due to rising raw material prices and higher manufacturing expenses. These costs are expected to impact the brand's ability to keep product prices competitive without compromising margins
- In March 2023, Nestlé Waters faced challenges in maintaining profitability for its flavored water products, particularly those with added functional ingredients, as the prices of natural and organic ingredients increased. This has led the company to focus on streamlining production processes to mitigate rising costs while staying competitive in the market
- In February 2023, Spindrift announced that higher production costs, especially in sourcing real fruit for their flavored water line, had led to increased product prices. As a result, the company faced difficulties in balancing the high-end positioning of their brand with the need to stay affordable for a broad consumer base
- The challenges posed by high production costs and price pressures limit the ability of flavored water companies to scale in certain markets, particularly in regions where consumers are more price-sensitive or where low-cost alternatives dominate the beverage landscape
Flavored Water Market Scope
The market is segmented on the basis type, packaging type, distribution channel, product type, and product.
|
Segmentation |
Sub-Segmentation |
|
By Type |
|
|
By Packaging Type |
|
|
By Distribution Channel |
|
|
By Product Type
|
|
|
By Product |
|
Flavored Water Market Regional Analysis
“North America is the Dominant Region in the Flavored Water Market”
- North America leads the global flavored water market, driven by increasing consumer preference for healthier beverage options, strong market demand for functional drinks, and the presence of key industry players
- The U.S. in particular, holds a significant share of the market, fueled by the rising health-consciousness among consumers, a growing wellness trend, and the availability of a wide variety of flavored water products with functional benefits such as added electrolytes, vitamins, and minerals
- The region’s well-established retail infrastructure, including supermarkets, convenience stores, and online platforms, supports easy access to flavored water products, further driving market growth. In addition, the rapid adoption of functional beverages by consumers is accelerating the demand for flavored water
- The presence of leading beverage companies like PepsiCo, Coca-Cola, and Nestlé Waters in the region strengthens market growth, as these companies continue to innovate and introduce new flavored water products catering to diverse consumer needs
“Asia-Pacific is Projected to Register the Highest Growth Rate”
- The Asia-Pacific region is anticipated to experience the highest growth rate in the global flavored water market, driven by the increasing demand for healthier beverage options, a rising middle-class population, and shifting consumer preferences towards functional drinks
- Countries such as China, India, and Japan are emerging as key markets due to the growing health-consciousness among consumers, an increase in disposable income, and changing lifestyles, which are fueling the demand for flavored water as a low-calorie, refreshing alternative to sugary soft drinks
- Japan, with its advanced food and beverage industry, continues to lead in the adoption of new product innovations in the flavored water sector, including premium offerings with functional ingredients such as electrolytes, vitamins, and minerals
- China and India, with their large and expanding populations, are witnessing a rise in consumer awareness about health and wellness, driving the demand for flavored water as a healthier choice. The increasing availability of flavored water in supermarkets, convenience stores, and e-commerce platforms further supports market growth in these regions
Flavored Water Market Share
The market competitive landscape provides details by competitor. Details included are company overview, company financials, revenue generated, market potential, investment in research and development, new market initiatives, global presence, production sites and facilities, production capacities, company strengths and weaknesses, product launch, product width and breadth, application dominance. The above data points provided are only related to the companies' focus related to market.
The Major Market Leaders Operating in the Market Are:
- Danone (France)
- The Coca-Cola Company (U.S.)
- PepsiCo (U.S.)
- Keurig Dr Pepper, Inc. (U.S.)
- Trimino Protein Infused Water (U.S.)
- NYSW Beverage Brands, Inc. (U.S.)
- Disruptive Beverages Inc. (U.S.)
- Vichy Catalan Corporation (Spain)
- AGUA MINERAL SAN BENEDETTO, S.A.U. (Italy)
- Unique Foods (Canada) Inc. (Canada)
- Keurig Green Mountain, Inc. (U.S.)
- Nestlé (Switzerland)
- Allure Organics (U.S.)
- Tata Consumer Products (India)
- Alkaline88, LLC (U.S.)
- Nirvana Water (U.S.)
- Balance Trading Company (U.S.)
- Hint Inc. (U.S.)
- SUNNYD (U.S.)
Latest Developments in Global Flavored Water Market
- In November 2023, Coca-Cola expanded its Smartwater brand in Japan, introducing new flavor combinations and emphasizing functional hydration, catering to the growing demand for health-focused beverages in the region
- In April 2023, Nestlé Waters launched a new line of flavored waters in India under the Nestlé Pure Life brand, targeting health-conscious consumers in major cities with a growing appetite for low-sugar, refreshing hydration options
- In June 2022, PepsiCo expanded its Bubly flavored water range in China, capitalizing on the increasing interest in healthier beverages and positioning itself as a key player in the growing flavored water segment
- In May 2022, Coca-Cola introduced new innovations under its Smartwater brand in the U.S., focusing on new flavors and hydration benefits to meet the rising demand for refreshing and functional flavored water products
SKU-

- Interactive Data Analysis Dashboard
- Company Analysis Dashboard for high growth potential opportunities
- Research Analyst Access for customization & queries
- Competitor Analysis with Interactive dashboard
- Latest News, Updates & Trend analysis
- Harness the Power of Benchmark Analysis for Comprehensive Competitor Tracking
Table of Content
1. INTRODUCTION
1.1 OBJECTIVES OF THE STUDY
1.2 MARKET DEFINITION
1.3 OVERVIEW OF GLOBAL FLAVORED WATER MARKET
1.4 CURRENCY AND PRICING
1.5 LIMITATION
1.6 MARKETS COVERED
2. MARKET SEGMENTATION
2.1 KEY TAKEAWAYS
2.2 ARRIVING AT THE GLOBAL FLAVORED WATER MARKET SIZE
2.2.1 VENDOR POSITIONING GRID
2.2.2 TECHNOLOGY LIFE LINE CURVE
2.2.3 MARKET GUIDE
2.2.4 COMPANY POSITIONING GRID
2.2.5 COMAPANY MARKET SHARE ANALYSIS
2.2.6 MULTIVARIATE MODELLING
2.2.7 DEMAND AND SUPPLY-SIDE VARIABLES
2.2.8 TOP TO BOTTOM ANALYSIS
2.2.9 STANDARDS OF MEASUREMENT
2.2.10 VENDOR SHARE ANALYSIS
2.2.11 DATA POINTS FROM KEY PRIMARY INTERVIEWS
2.2.12 DATA POINTS FROM KEY SECONDARY DATABASES
2.3 GLOBAL FLAVORED WATER MARKET: RESEARCH SNAPSHOT
2.4 ASSUMPTIONS
3. MARKET OVERVIEW
3.1 DRIVERS
3.2 RESTRAINTS
3.3 OPPORTUNITIES
3.4 CHALLENGES
4. EXECUTIVE SUMMARY
5. PREMIUM INSIGHTS
5.1 SUPPLY CHAIN ANALYSIS
5.2 FACTORS INFLUENCING PURCHASING DECISION
5.3 INDUSTRY TRENDS AND FUTURE PERSPECTIVES
5.4 GROWTH STRATEGIES ADOPTED BY KEY PLAYERS
5.5 SHOPPING BEHAVIOUR AND DYNAMICS
5.5.1 RECOMMENDATION FROM FAMILY & FRIENDS
5.5.2 RESEARCH
5.5.3 IMPULSIVE
5.5.4 ADVERTISEMENT
5.5.4.1. TELEVISION ADVERTISEMENT
5.5.4.2. ONLINE ADVERTISEMENT
5.5.4.3. IN-STORE ADVERTISEMENT
5.5.4.4. OUTDOOR ADVERTISEMENT
5.6 PRIVATE LABEL VS BRAND ANALYSIS
5.7 PROMOTIONAL ACTIVITIES
5.8 CONSUMER DISPOSABLE INCOME DYNAMICS/SPEND DYNAMICS
5.9 NEW PRODUCT LAUNCH STRATEGY
5.9.1 NUMBER OF NEW PRODUCT LAUNCH
5.9.1.1. LINE EXTENSTION
5.9.1.2. NEW PACKAGING
5.9.1.3. RE-LAUNCHED
5.9.1.4. NEW FORMULATION
5.10 CONSUMER LEVEL TRENDS
5.11 MEETING CONSUMER REQUIREMENT
6. IMPACT OF ECONOMIC SLOW DOWN ON MARKET
6.1 IMPACT ON PRICE
6.2 IMPACT ON SUPPLY CHAIN
6.3 IMPACT ON SHIPMENT
6.4 IMPACT ON COMPANY’S STRATEGIC DECISIONS
7. REGULATORY FRAMEWORK AND GUIDELINES
8. PRICING ANALYSIS
9. BRAND OUTLOOK
9.1 COMPARATIVE BRAND ANALYSIS
9.2 PRODUCT VS BRAND OVERVIEW
10. GLOBAL FLAVORED WATER MARKET, BY TYPE, 2021-2030, (USD MILLION)
(ASP, VALUE AND VOLUME WILL BE PROVIDED FOR ALL THE SEGMENTS)
10.1 OVERVIEW
10.2 CARBONATED
10.2.1 CARBONATED FLAVOR WATERS, BY FLAVOR
10.2.1.1. KIWI
10.2.1.2. PEAR
10.2.1.3. VANILLA
10.2.1.4. LEMON
10.2.1.5. PINEAPPLE
10.2.1.6. GRAPE FRUIT
10.2.1.7. MANGO
10.2.1.8. PEACH
10.2.1.9. APPLE
10.2.1.10. BERRY
10.2.1.11. WATERMELON
10.2.1.12. COLA
10.2.1.13. COCONUT
10.2.1.14. POMEGRANATE
10.2.1.15. PASSION FRUIT
10.2.1.16. MULTIPLE FLAVOR MIX
10.2.1.17. OTHERS
10.3 NON-CARBONATED / STILL
10.3.1 NON-CARBONATED / STILL FLAVOR WATERS, BY FLAVOR
10.3.1.1. KIWI
10.3.1.2. PEAR
10.3.1.3. VANILLA
10.3.1.4. LEMON
10.3.1.5. PINEAPPLE
10.3.1.6. GRAPE FRUIT
10.3.1.7. MANGO
10.3.1.8. PEACH
10.3.1.9. APPLE
10.3.1.10. BERRY
10.3.1.11. WATERMELON
10.3.1.12. COLA
10.3.1.13. COCONUT
10.3.1.14. POMEGRANATE
10.3.1.15. PASSION FRUIT
10.3.1.16. MULTIPLE FLAVOR MIX
10.3.1.17. OTHERS
11. GLOBAL FLAVORED WATER MARKET, BY FLAVOR, 2021-2030, (USD MILLION)
11.1 OVERVIEW
11.2 KIWI
11.3 PEAR
11.4 VANILLA
11.5 LEMON
11.6 PINEAPPLE
11.7 GRAPE FRUIT
11.8 MANGO
11.9 PEACH
11.10 APPLE
11.11 BERRY
11.11.1 RASPBERRY
11.11.2 BLUEBERRY
11.11.3 STARAWBERRY
11.11.4 BLACKBERRY
11.11.5 CHERRY
11.12 WATERMELON
11.13 COLA
11.14 COCONUT
11.15 POMEGRANATE
11.16 PASSION FRUIT
11.17 MULTIPLE FLAVOR MIX
11.18 OTHERS
12. GLOBAL FLAVORED WATER MARKET, BY PACKAGING TYPE, 2021-2030, (USD MILLION)
12.1 OVERVIEW
12.2 CANS
12.3 BOTTLES
12.3.1 PLASTIC
12.3.2 GLASS
12.4 POUCHES / SACHETS
12.5 TETRA PACKS
12.6 OTHERS
13. GLOBAL FLAVORED WATER MARKET, BY DISTRIBUTION CHANNEL, 2021-2030, (USD MILLION)
13.1 OVERVIEW
13.2 STORE BASED RETAILERS
13.2.1 SUPERMARKETS/HYPERMARKETS
13.2.2 GROCERY STORES
13.2.3 CONVENIENCE STORES
13.2.4 SPECIALITY STORES
13.2.5 OTHERS
13.3 NON-STORE RETAILERS
13.3.1 E-COMMERCE WEBSITES
13.3.2 COMPANY WEBSITES
13.3.3 VENDING MACHINES
14. GLOBAL FLAVORED WATER MARKET, BY NATURE, 2021-2030, (USD MILLION)
14.1 OVERVIEW
14.2 ORGANIC
14.3 CONVENTIONAL
15. GLOBAL FLAVORED WATER MARKET, BY BRAND CATEGORY, 2021-2030, (USD MILLION)
15.1 OVERVIEW
15.2 BRANDED
15.3 PRIVATE LABEL
16. GLOBAL FLAVORED WATER MARKET, BY SUGAR CATEGORY, 2021-2030, (USD MILLION)
16.1 OVERVIEW
16.2 SWEETENED
16.3 UNSWEETENED
17. GLOBAL FLAVORED WATER MARKET, BY CLAIM, 2021-2030, (USD MILLION)
17.1 OVERVIEW
17.2 GLUTEN FREE
17.3 ARTIFICIAL COLOR FREE
17.4 PRESERVATIVES FREE
17.5 ALL ABOVE CLAIMS
17.6 MULTIPLE CLAIMS
17.7 OTHER CLAIMS
17.8 NO CLAIM / REGULAR
18. GLOBAL FLAVORED WATER MARKET, BY PACKAGING SIZE, 2021-2030, (USD MILLION)
18.1 OVERVIEW
18.2 LESS THAN 250 ML
18.3 251-500 ML
18.4 501-750 ML
18.5 751-1000 ML
18.6 MORE THAN 1000 ML
19. GLOBAL FLAVORED WATER MARKET, BY END USER, 2021-2030, (USD MILLION)
19.1 OVERVIEW
19.2 HOUSEHOLD / RETAIL
19.3 FOOD SERVICE SECTOR
19.3.1 FOOD SERVICE SECTOR, BY TYPE
19.3.1.1. HOTELS
19.3.1.2. RESTAURANTS
19.3.1.3. CAFÉS
19.3.1.4. BARS
19.3.1.5. CLUBS
19.3.1.6. OTHERS
20. GLOBAL FLAVORED WATER MARKET, BY GEOGRAPHY, 2021-2030, (USD MILLION)
20.1 OVERVIEW (ALL SEGMENTATION PROVIDED ABOVE IS REPRESNTED IN THIS CHAPTER BY COUNTRY)
20.2 NORTH AMERICA
20.2.1 U.S.
20.2.2 CANADA
20.2.3 MEXICO
20.3 EUROPE
20.3.1 GERMANY
20.3.2 U.K.
20.3.3 ITALY
20.3.4 FRANCE
20.3.5 SPAIN
20.3.6 SWITZERLAND
20.3.7 NETHERLANDS
20.3.8 BELGIUM
20.3.9 RUSSIA
20.3.10 TURKEY
20.3.11 NORWAY
20.3.12 FINLAND
20.3.13 SWEDEN
20.3.14 DENMARK
20.3.15 POLAND
20.3.16 REST OF EUROPE
20.4 ASIA-PACIFIC
20.4.1 JAPAN
20.4.2 CHINA
20.4.3 SOUTH KOREA
20.4.4 INDIA
20.4.5 AUSTRALIA
20.4.6 SINGAPORE
20.4.7 THAILAND
20.4.8 INDONESIA
20.4.9 MALAYSIA
20.4.10 PHILIPPINES
20.4.11 TAIWAN
20.4.12 VIETNAM
20.4.13 NEW ZEALAND
20.4.14 REST OF ASIA-PACIFIC
20.5 SOUTH AMERICA
20.5.1 BRAZIL
20.5.2 ARGENTINA
20.5.3 REST OF SOUTH AMERICA
20.6 MIDDLE EAST AND AFRICA
20.6.1 SOUTH AFRICA
20.6.2 UAE
20.6.3 SAUDI ARABIA
20.6.4 KUWAIT
20.6.5 EGYPT
20.6.6 ISRAEL
20.6.7 OMAN
20.6.8 BAHRAIN
20.6.9 REST OF MIDDLE EAST AND AFRICA
21. GLOBAL FLAVORED WATER MARKET, COMPANY LANDSCAPE
21.1 COMPANY SHARE ANALYSIS: GLOBAL
21.2 COMPANY SHARE ANALYSIS: NORTH AMERICA
21.3 COMPANY SHARE ANALYSIS: EUROPE
21.4 COMPANY SHARE ANALYSIS: ASIA-PACIFIC
21.5 MERGERS & ACQUISITIONS
21.6 NEW PRODUCT DEVELOPMENT & APPROVALS
21.7 EXPANSIONS & PARTNERSHIP
21.8 REGULATORY CHANGES
22. GLOBAL FLAVORED WATER MARKET, SWOT & DBMR ANALYSIS
23. GLOBAL FLAVORED WATER MARKET, COMPANY PROFILE
23.1 PEPSICO INC.
23.1.1 COMPANY OVERVIEW
23.1.2 REVENUE ANALYSIS
23.1.3 GEOGRAPHICAL PRESENCE
23.1.4 PRODUCT PORTFOLIO
23.1.5 RECENT DEVELOPMENTS
23.2 THE COCA-COLA COMPANY
23.2.1 COMPANY OVERVIEW
23.2.2 REVENUE ANALYSIS
23.2.3 GEOGRAPHICAL PRESENCE
23.2.4 PRODUCT PORTFOLIO
23.2.5 RECENT DEVELOPMENTS
23.3 CRYSTAL GEYSER WATER COMPANY
23.3.1 COMPANY OVERVIEW
23.3.2 REVENUE ANALYSIS
23.3.3 GEOGRAPHICAL PRESENCE
23.3.4 PRODUCT PORTFOLIO
23.3.5 RECENT DEVELOPMENTS
23.4 HINT INC.
23.4.1 COMPANY OVERVIEW
23.4.2 REVENUE ANALYSIS
23.4.3 GEOGRAPHICAL PRESENCE
23.4.4 PRODUCT PORTFOLIO
23.4.5 RECENT DEVELOPMENTS
23.5 NESTLE S.A.
23.5.1 COMPANY OVERVIEW
23.5.2 REVENUE ANALYSIS
23.5.3 GEOGRAPHICAL PRESENCE
23.5.4 PRODUCT PORTFOLIO
23.5.5 RECENT DEVELOPMENTS
23.6 THE KRAFT HEINZ COMPANY
23.6.1 COMPANY OVERVIEW
23.6.2 REVENUE ANALYSIS
23.6.3 GEOGRAPHICAL PRESENCE
23.6.4 PRODUCT PORTFOLIO
23.6.5 RECENT DEVELOPMENTS
23.7 DANONE S.A.
23.7.1 COMPANY OVERVIEW
23.7.2 REVENUE ANALYSIS
23.7.3 GEOGRAPHICAL PRESENCE
23.7.4 PRODUCT PORTFOLIO
23.7.5 RECENT DEVELOPMENTS
23.8 KEURIG DR PEPPER, INC.
23.8.1 COMPANY OVERVIEW
23.8.2 REVENUE ANALYSIS
23.8.3 GEOGRAPHICAL PRESENCE
23.8.4 PRODUCT PORTFOLIO
23.8.5 RECENT DEVELOPMENTS
23.9 POLAR BEVERAGES
23.9.1 COMPANY OVERVIEW
23.9.2 REVENUE ANALYSIS
23.9.3 GEOGRAPHICAL PRESENCE
23.9.4 PRODUCT PORTFOLIO
23.9.5 RECENT DEVELOPMENTS
23.10 TALKING RAIN BEVERAGE CO.
23.10.1 COMPANY OVERVIEW
23.10.2 REVENUE ANALYSIS
23.10.3 GEOGRAPHICAL PRESENCE
23.10.4 PRODUCT PORTFOLIO
23.10.5 RECENT DEVELOPMENTS
23.11 TRIMINO PROTEIN INFUSED WATER
23.11.1 COMPANY OVERVIEW
23.11.2 REVENUE ANALYSIS
23.11.3 GEOGRAPHICAL PRESENCE
23.11.4 PRODUCT PORTFOLIO
23.11.5 RECENT DEVELOPMENTS
23.12 NYSW BEVERAGE BRANDS, INC.
23.12.1 COMPANY OVERVIEW
23.12.2 REVENUE ANALYSIS
23.12.3 GEOGRAPHICAL PRESENCE
23.12.4 PRODUCT PORTFOLIO
23.12.5 RECENT DEVELOPMENTS
23.13 DISRUPTIVE BEVERAGES INC.
23.13.1 COMPANY OVERVIEW
23.13.2 REVENUE ANALYSIS
23.13.3 GEOGRAPHICAL PRESENCE
23.13.4 PRODUCT PORTFOLIO
23.13.5 RECENT DEVELOPMENTS
23.14 VICHY CATALAN CORPORATION
23.14.1 COMPANY OVERVIEW
23.14.2 REVENUE ANALYSIS
23.14.3 GEOGRAPHICAL PRESENCE
23.14.4 PRODUCT PORTFOLIO
23.14.5 RECENT DEVELOPMENTS
23.15 SUNNY DELIGHT BEVERAGES CO.
23.15.1 COMPANY OVERVIEW
23.15.2 REVENUE ANALYSIS
23.15.3 GEOGRAPHICAL PRESENCE
23.15.4 PRODUCT PORTFOLIO
23.15.5 RECENT DEVELOPMENTS
23.16 SPINDRIFT BEVERAGE CO.
23.16.1 COMPANY OVERVIEW
23.16.2 REVENUE ANALYSIS
23.16.3 GEOGRAPHICAL PRESENCE
23.16.4 PRODUCT PORTFOLIO
23.16.5 RECENT DEVELOPMENTS
*NOTE: THE COMPANIES PROFILED IS NOT EXHAUSTIVE LIST AND IS AS PER OUR PREVIOUS CLIENT REQUIREMENT. WE PROFILE MORE THAN 100 COMPANIES IN OUR STUDY AND HENCE THE LIST OF COMPANIES CAN BE MODIFIED OR REPLACED ON REQUEST
24. RELATED REPORTS
25. CONCLUSION
26. QUESTIONNAIRE
27. ABOUT DATA BRIDGE MARKET RESEARCH
Global Flavored Water Market, Supply Chain Analysis and Ecosystem Framework
To support market growth and help clients navigate the impact of geopolitical shifts, DBMR has integrated in-depth supply chain analysis into its Global Flavored Water Market research reports. This addition empowers clients to respond effectively to global changes affecting their industries. The supply chain analysis section includes detailed insights such as Global Flavored Water Market consumption and production by country, price trend analysis, the impact of tariffs and geopolitical developments, and import and export trends by country and HSN code. It also highlights major suppliers with data on production capacity and company profiles, as well as key importers and exporters. In addition to research, DBMR offers specialized supply chain consulting services backed by over a decade of experience, providing solutions like supplier discovery, supplier risk assessment, price trend analysis, impact evaluation of inflation and trade route changes, and comprehensive market trend analysis.
Data collection and base year analysis are done using data collection modules with large sample sizes. The stage includes obtaining market information or related data through various sources and strategies. It includes examining and planning all the data acquired from the past in advance. It likewise envelops the examination of information inconsistencies seen across different information sources. The market data is analysed and estimated using market statistical and coherent models. Also, market share analysis and key trend analysis are the major success factors in the market report. To know more, please request an analyst call or drop down your inquiry.
The key research methodology used by DBMR research team is data triangulation which involves data mining, analysis of the impact of data variables on the market and primary (industry expert) validation. Data models include Vendor Positioning Grid, Market Time Line Analysis, Market Overview and Guide, Company Positioning Grid, Patent Analysis, Pricing Analysis, Company Market Share Analysis, Standards of Measurement, Global versus Regional and Vendor Share Analysis. To know more about the research methodology, drop in an inquiry to speak to our industry experts.
Data Bridge Market Research is a leader in advanced formative research. We take pride in servicing our existing and new customers with data and analysis that match and suits their goal. The report can be customized to include price trend analysis of target brands understanding the market for additional countries (ask for the list of countries), clinical trial results data, literature review, refurbished market and product base analysis. Market analysis of target competitors can be analyzed from technology-based analysis to market portfolio strategies. We can add as many competitors that you require data about in the format and data style you are looking for. Our team of analysts can also provide you data in crude raw excel files pivot tables (Fact book) or can assist you in creating presentations from the data sets available in the report.


