
Ice-cream Dry Mixes Market Analysis and Insights
The global ice-cream dry mixes market is defined as the industry engaged in the production and distribution of pre-blended ingredients used in the preparation of ice cream. Ice cream mix typically comprises a combination of milk solids, sweeteners, stabilizers, emulsifiers, and flavorings.
The global ice-cream dry mixes market report provides details of market share, new developments, and product pipeline analysis, the impact of domestic and localized market players, analyzes opportunities in terms of emerging revenue pockets, changes in market regulations, product approvals, strategic decisions, product launches, geographic expansions, and technological innovations in the market. To understand the analysis and the market scenario contact us for an Analyst Brief, our team will help you create a revenue impact solution to achieve your desired goal.
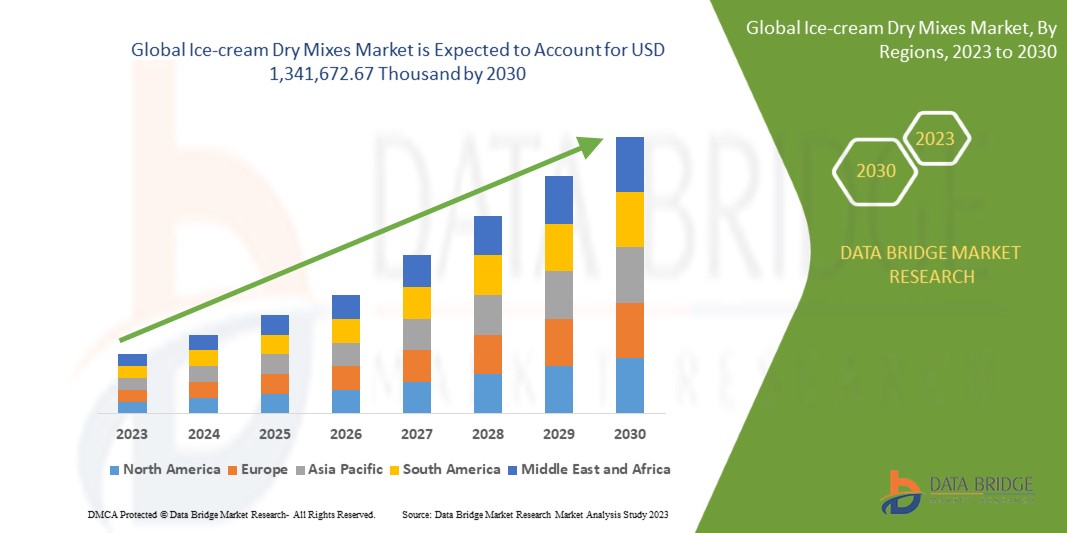
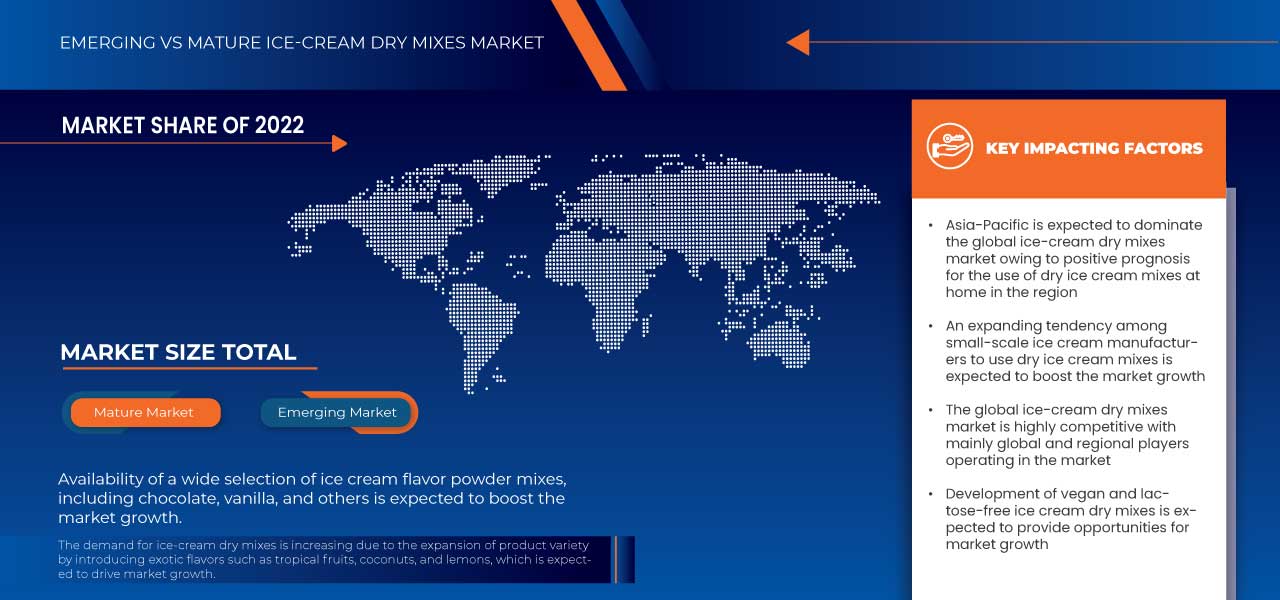
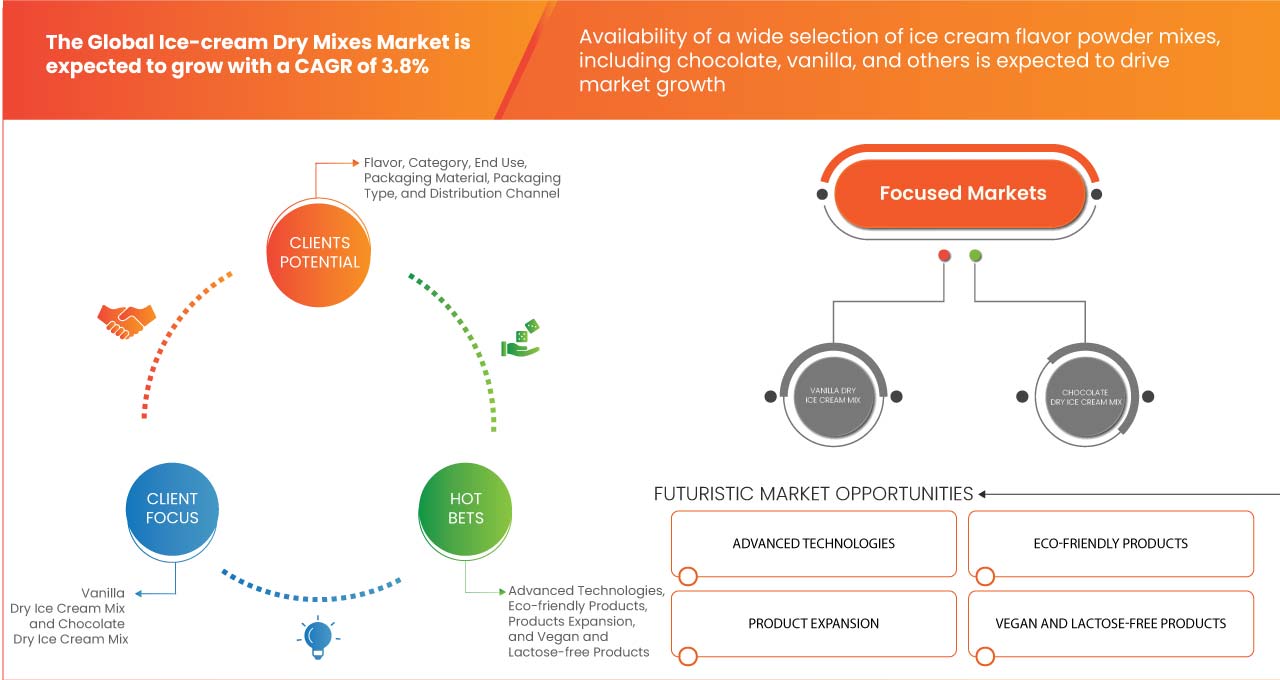
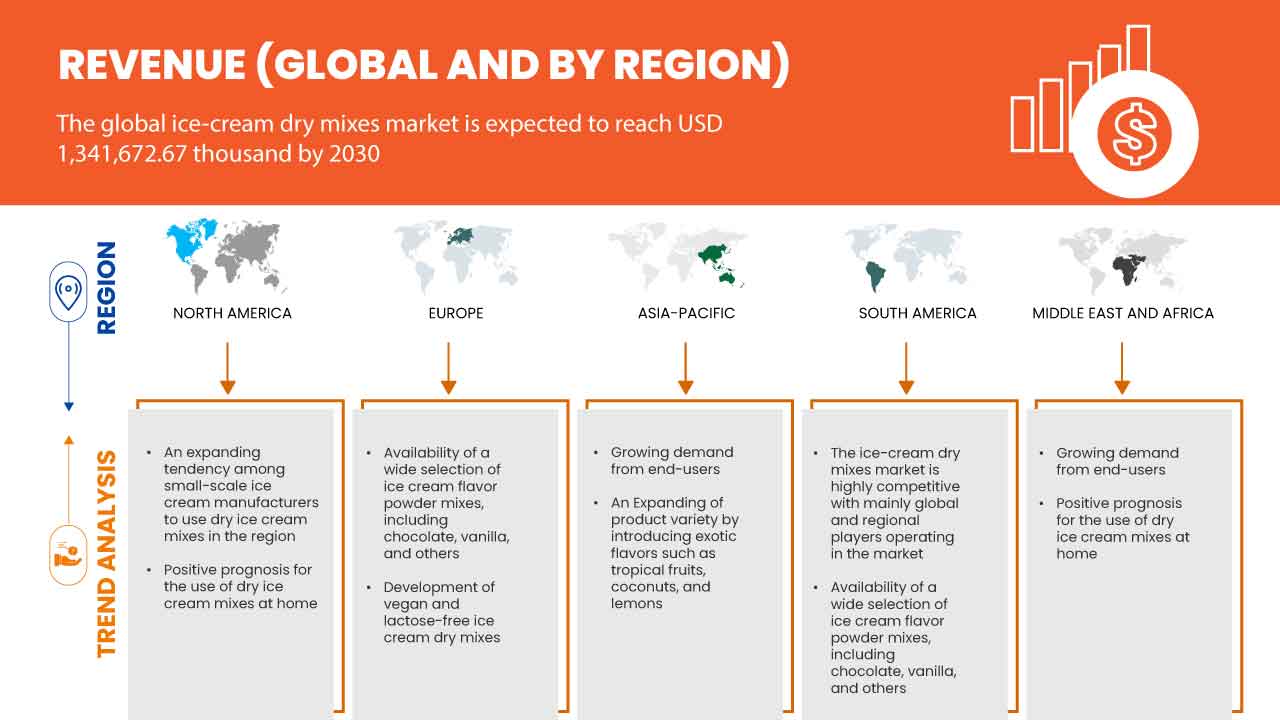
The global ice-cream dry mixes market is expected to gain market growth in the forecast period of 2023 to 2030. Data Bridge Market Research analyzes that the market is growing at a CAGR of 3.8% in the forecast period of 2023 to 2030 and expected to reach USD 1,341,672.67 thousand by 2030. The positive prognosis for the use of dry ice cream mixes at home, and the availability of a wide selection of ice cream flavor powder mixes, including chocolate, vanilla, and others are some of the driving factors expected to propel the market growth.
|
Report Metric |
Details |
|
Forecast Period |
2023 to 2030 |
|
Base Year |
2022 |
|
Historic Years |
2021 (Customizable to 2015-2020) |
|
Quantitative Units |
Revenue in USD Thousand, Volume in Tons, and Average Selling Price in USD per Kg |
|
Segments Covered |
Flavor (Chocolate Dry Ice Cream Mix, Vanilla Dry Ice Cream Mix, Strawberry Dry Ice Cream Mix, Mint Chocolate Chip Dry Ice Cream Mix, Cookies and Cream Dry Ice Cream Mix, Nutty Dry Ice Cream Mix, Coffee Dry Ice Cream Mix, Fruit Dry Ice Cream Mix, and Others), Category (Dairy Based and Non-Dairy Based), Packaging Material (Plastic, Paper/Paperboard, and Others), Packaging Type (Pouches & Bags, Boxes, and Other), Distribution Channel (B2B and B2C), End Use (Restaurants and Cafes, Ice Cream Manufacturers, Ice Cream Parlors and Shops, Home Ice Cream Makers, Catering Businesses, and Specialty Food Retailers) |
|
Countries Covered |
U.S., Canada, Mexico, Brazil, Argentina, Rest of South America, Germany, France, Italy, U.K., Belgium, Spain, Russia, Turkey, Netherlands, Switzerland, Rest of Europe, China, India, Japan, South Korea, Australia, Indonesia, Thailand, Vietnam, Philippines, Malaysia, Singapore and Rest of Asia-Pacific, United Arab Emirates, Saudi Arabia, Egypt, Kuwait, South Africa, Israel, and Rest of Middle East and Africa |
|
Market Players Covered |
Mr Dewie’s cashew creamery, Nimje Industries, Keliff's, Amrut International, Meadowvale, TOP Creamery, Dessertify, Lakeland, Wholefarm Australia Pty Ltd, Phoon Huat Pte Ltd., Amba Enterprise, Skyline Food Products LLP, COOKWELLFOODS, KWALITY, and Walnut Creek Foods among others |
Global Ice-cream Dry Mixes Market Dynamics
Drivers
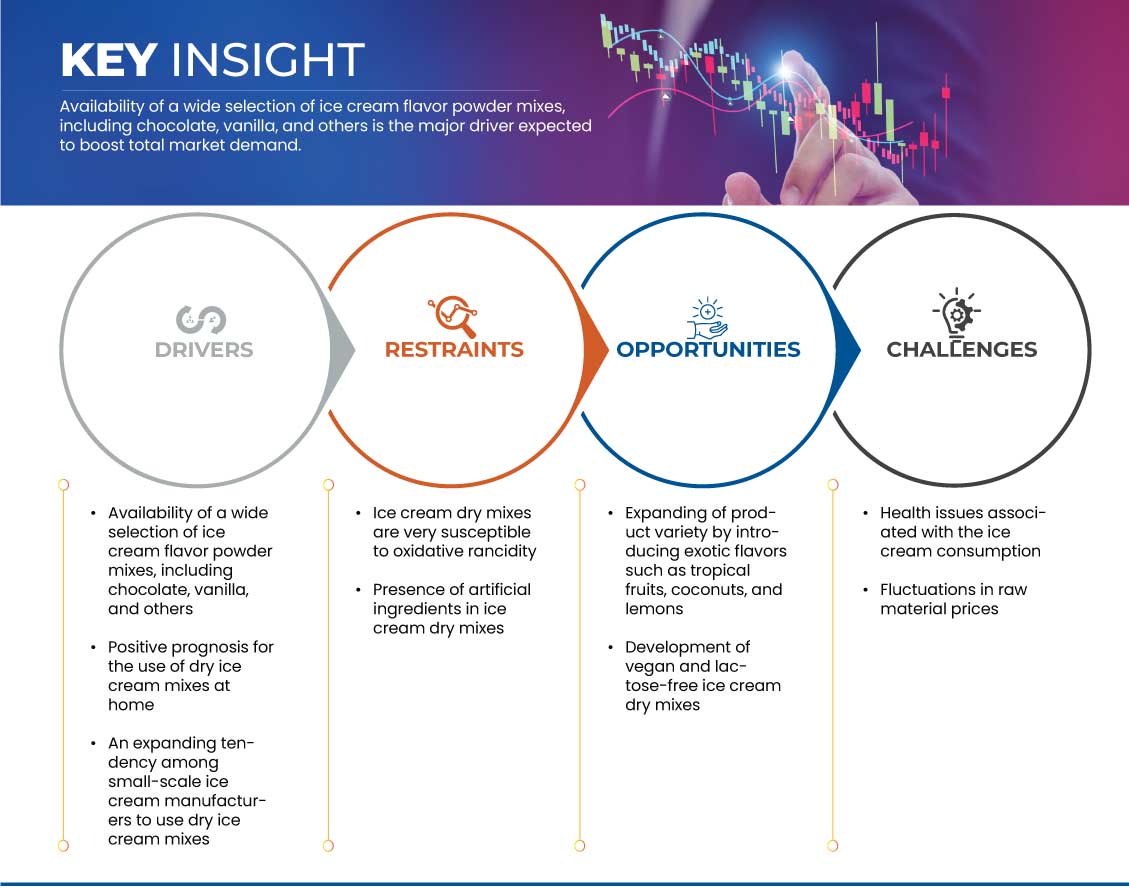
- Availability of a Wide Selection of Ice Cream Flavor Powder Mixes Including Chocolate, Vanilla, and Others
Manufacturers may provide ice cream lovers a distinctive experience in a variety of ways. Different flavors, including chocolate, vanilla, butterscotch, mango, milkshake, strawberry, kesar pista, cookies and cream, mint chocolate chip, coffee, butter pecan, rocky road, cookie dough, caramel swirl, pistachio, fudge brownie, coconut, butterfinger, red velvet, and others can be included in product variations.
Ice cream dry mix producers may serve a wider range of customers by catering to a variety of tastes and preferences by providing a choice of flavors. This variety may draw more customers, which can boost sales. Each batch of ice cream made with dry ingredients has consistent tastes and textures. Customers will experience the same quality with every purchase thanks to this, which will increase brand loyalty. Manufacturers are blending several dry mix tastes or adding mix-ins and toppings to create personalized flavors, producing distinctive products that set them apart from competitors. Manufacturers are swiftly responding to the shifting market trends and consumer expectations with a variety of dry mix flavors. New tastes are also being introduced based on vogue or seasonal preferences. Creating trademark flavors aids in creating a brand identity and distinguishing the ice cream produced by the business in the marketplace.
- Positive Prognosis for the Use of Dry Ice Cream Mixes at Home
There is no need for a specific ice cream machine when utilizing ice cream powder to create ice cream at home using a mixer. For an at-home experience, ice cream powder is the finest option. Only water, an electric mixer, and a freezer are required by users. Make wonderful ice cream by selecting the flavor, following the directions, and reading the recipe.
Dry ice cream mixes are a convenient and fast way to make homemade ice cream without the use of complicated recipes or specialized equipment. Purchasing ice cream powder mixes rather than pre-made ice cream from the shop may be more budget-friendly. By adding their own components to the powder mixture, users may experiment with various flavors and textures to create unique compositions. Since ice cream powder mixes have a longer shelf life, they are a convenient choice for special occasions or sudden desires for dessert.
Opportunities
- Expanding Product Variety by Introducing Exotic Flavours such as Tropical Fruits, Coconuts, and Lemons
Unusual flavors are added to increase product variety and set ice cream dry mixes apart from more common and readily available alternatives. They provide distinctive flavor sensations that may draw in customers searching for something fresh and interesting. Exotic flavor additions to ice cream dry mixes show a dedication to originality and ingenuity. It enables producers to experiment with conventional flavors and satisfy a variety of palates.
Exotic flavors appeal to a bigger and more varied consumer base, including those from various origins or those who love learning about other cultures' cuisines. They are perfect for limited-edition or seasonally-themed ice cream dry mixes since they can be influenced by seasonal fruits, local ingredients, or cultural events. Word-of-mouth marketing and social media buzz are frequently produced by distinctive and unusual tastes. The likelihood that customers would discuss their thrilling ice cream experiences may increase, thus boosting the product. One may get a gastronomic experience by trying new and unique cuisines. The ice cream dry mix may inspire customers to try out novel pairings, making it an intriguing and captivating product.
- Development of Vegan and Lactose-Free Ice Cream Dry Mixes
The global population has been embracing the vegan lifestyle more recently. People are adopting the lifestyle to enhance their general well-being and benefit their bodies on the inside and the outside. These advancements are also observed in the production of ice cream. For ethical, environmental, or health grounds, more individuals are switching to vegan or plant-based diets. As a result, vegan alternatives are more in demand in many food categories, including ice cream. Traditional dairy-based ice creams are inappropriate for many people due to lactose intolerance or dairy allergies. Dry mixes for lactose-free or vegan ice cream provide a delectable substitute free of any components originating from dairy. Dry mixes for vegan ice cream frequently contain plant-based components, which are thought of as better options.
Restraints
- Ice Cream Dry Mixes are very Susceptible to Oxidative Rancidity
Since dried ice cream mix contains a high amount of milk fat, oxidative rancidity is a major concern. When fats and oils are exposed to oxygen while being heated, illuminated, or in the presence of certain catalysts, a chemical process known as oxidative rancidity takes place. This process results in the breakdown of lipids into undesirable chemicals, giving the finished product unpleasant tastes and odors.
Unsaturated fatty acids found in vegetable or milk fats, which are contained in dry ice cream mixtures, make them more prone to oxidation. The quality of fats and oils used in the dry mix can affect its susceptibility to oxidative rancidity, and it may occur more quickly if low-quality or inferior oils are used. If the dry mix is not properly sealed and exposed to air, oxygen can react with the fats, promoting oxidation. Soaking the dry ice cream mix in warm and humid conditions can speed up the rate of oxidative reactions, leading to rancidity.
- Presence of Artificial Ingredients in Ice Cream Dry Mixes
Depending on the exact brand and product composition, the amount of artificial additives in ice cream dry mixes can change. Artificial substances may be included in certain ice cream dry mixes to improve flavor, texture, and shelf life. Common artificial ingredients that may be found in ice cream dry mixes include artificial flavors (artificial vanilla, chocolate, strawberry, mint, fruit, nut, coffee, caramel, butter, and others), artificial colors (sunset yellow, allura red, brilliant blue, indigo carmine, erythrosine, green S, tartrazine, and others), artificial sweeteners (aspartame, acesulfame potassium (Ace-K), sucralose, saccharin, neotame, advantame, and others), emulsifiers (polysorbate 80, mono- and diglycerides, carrageenan, guar gum, and others), stabilizers (cellulose gum, xanthan gum, guar gum, locust bean gum, sodium alginate, propylene glycol alginate (PGA), and others), preservatives (potassium sorbate, sodium benzoate, calcium propionate, propylparaben, and others), and antioxidants (butylated hydroxyanisole (BHA), butylated hydroxyltoluene (BHT), propyl gallate, ethoxyquin, and others).
Challenge
- Health Issues Associated with the Ice Cream Consumption
Even though it is a beloved and satisfying dessert, ice cream intake has some possible health risks. Consuming ice cream in moderation and being conscious of your health is vital. The high calorie and sugar content of ice cream can cause weight gain and raise the risk of type 2 diabetes, obesity, and other chronic health issues. When taken in excess, ice cream's high saturated fat content can elevate cholesterol levels and increase the risk of heart disease.
Lactose, a natural sugar present in dairy products, may be found in traditional ice cream. After having ice cream, people who have lactose intolerance may feel digestive discomfort, such as bloating, gas, and diarrhea. Those who have allergies or sensitivities to certain foods, such as milk, almonds, soy, and wheat, may experience adverse responses if ice cream contains these allergens. Ice cream contains a lot of sugar, which can cause blood sugar levels to rise quickly, especially in people who are diabetic or have insulin resistance.
Global Ice-cream Dry Mixes Market Scope
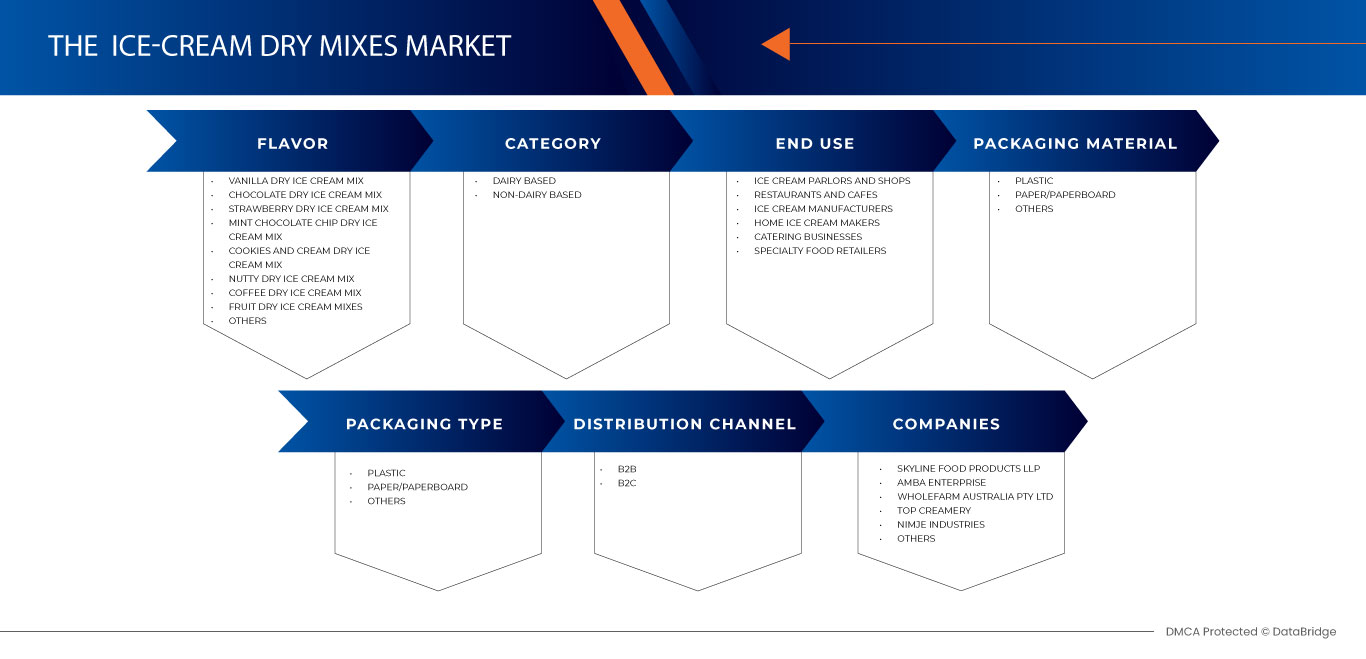
The global ice-cream dry mixes market is segmented into six notable segments based on flavor, category, packaging material, packaging type, distribution channel, and end use. The growth among segments helps you analyze niche pockets of growth and strategies to approach the market and determine your core application areas and the difference in your target markets.
Flavor
- Chocolate Dry Ice Cream Mix
- Vanilla Dry Ice Cream Mix
- Strawberry Dry Ice Cream Mix
- Mint Chocolate Chip Dry Ice Cream Mix
- Cookies And Cream Dry Ice Cream Mix
- Nutty Dry Ice Cream Mix
- Coffee Dry Ice Cream Mix
- Fruit Dry Ice Cream Mix
- Others
On the basis of flavor, the market is segmented into chocolate dry ice cream mix, vanilla dry ice cream mix, strawberry dry ice cream mix, mint chocolate chip dry ice cream mix, cookies and cream dry ice cream mix, nutty dry ice cream mix, coffee dry ice cream mix, fruit dry ice cream mix, and others.
Category
- Dairy Based
- Non-Dairy Based
On the basis of category, the market is segmented into dairy based and non-dairy based.
Packaging Material
- Plastic
- Paper/Paperboard
- Others
On the basis of packaging material, the market is segmented into plastic, paper/paperboard, and others.
Packaging Type
- Pouches & Bags
- Boxes
- Others
On the basis of packaging type, the market is segmented into pouches & bags, boxes, and others.
Distribution Channel
- B2B
- B2C
On the basis of distribution channel, the market is segmented into B2C and B2B.
End Use
- Restaurants and Cafes
- Ice Cream Manufacturers
- Ice Cream Parlors and Shops
- Home Ice Cream Makers
- Catering Businesses
- Specialty Food Retailers
On the basis of end use, the market is segmented into restaurants and cafes, ice cream manufacturers, ice cream parlors and shops, home ice cream makers, catering businesses, and specialty food retailers.
Global Ice-cream Dry Mixes Market Regional/Country Level Analysis
The global ice-cream dry mixes market is analyzed and market size information is provided by flavor, category, packaging material, packaging type, distribution channel, and end use as referenced above.
The countries covered in this market report are U.S., Canada, Mexico, Brazil, Argentina, Rest of South America, Germany, France, Italy, U.K., Belgium, Spain, Russia, Turkey, Netherlands, Switzerland, Rest of Europe, China, India, Japan, South Korea, Australia, Indonesia, Thailand, Vietnam, Philippines, Malaysia, Singapore and Rest of Asia-Pacific, United Arab Emirates, Saudi Arabia, Egypt, Kuwait, South Africa, Israel, and Rest of Middle East and Africa.
Asia-Pacific is expected to dominate the market due to the availability of a wide selection of ice cream flavor powder mixes, which is expected to provide growth opportunities in the region. China is expected to dominate the market in Asia-Pacific region due to expanding tendency among small-scale ice cream manufacturers to use dry ice cream mixes. Germany is expected to dominate the market in the Europe region as it is a cost-effective alternative for both producers and consumers due to reduced cold storage and transportation costs. The U.S. is expected to dominate the market in the North America region due to the wide availability of a wide selection of ice cream flavor powder mixes including chocolate, vanilla, and others.
The country section of the report also provides individual market-impacting factors and changes in regulation in the market domestically that impact the current and future trends of the market. Data points such as new sales, replacement sales, country demographics, regulatory acts, and import-export tariffs are some of the major pointers used to forecast the market scenario for individual countries. Also, the presence and availability of global brands and their challenges faced due to large or scarce competition from local and domestic brands, and the impact of sales channels are considered while providing forecast analysis of the country data.
Competitive Landscape and the Global Ice-Cream Dry Mixes Market Share Analysis
The global ice-cream dry mixes market competitive landscape provides details of competitors. Details included are company overview, company financials, revenue generated, market potential, investment in research and development, new market initiatives, global presence, production sites and facilities, company strengths and weaknesses, product launch, clinical trials pipelines, brand analysis, product approvals, patents, product width and breath, application dominance, technology lifeline curve. The above data points provided are only related to the company’s focus related to the market.
The major players covered in this report are Mr Dewie’s cashew creamery, Nimje Industries, Keliff's, Amrut International, Meadowvale, TOP Creamery, Dessertify, Lakeland, Wholefarm Australia Pty Ltd, Phoon Huat Pte Ltd., Amba Enterprise, Skyline Food Products LLP, COOKWELLFOODS, KWALITY, and Walnut Creek Foods among others.
SKU-

- Interactive Data Analysis Dashboard
- Company Analysis Dashboard for high growth potential opportunities
- Research Analyst Access for customization & queries
- Competitor Analysis with Interactive dashboard
- Latest News, Updates & Trend analysis
- Harness the Power of Benchmark Analysis for Comprehensive Competitor Tracking
Table of Content
1 INTRODUCTION
1.1 OBJECTIVES OF THE STUDY
1.2 MARKET DEFINITION
1.3 OVERVIEW
1.4 LIMITATIONS
1.5 MARKETS COVERED
2 MARKET SEGMENTATION
2.1 MARKETS COVERED
2.2 GEOGRAPHICAL SCOPE
2.3 YEARS CONSIDERED FOR THE STUDY
2.4 CURRENCY AND PRICING
2.5 DBMR TRIPOD DATA VALIDATION MODEL
2.6 MULTIVARIATE MODELING
2.7 PRIMARY INTERVIEWS WITH KEY OPINION LEADERS
2.8 DBMR MARKET POSITION GRID
2.9 MARKET END USE COVERAGE GRID
2.1 DBMR VENDOR SHARE ANALYSIS
2.11 SECONDARY SOURCES
2.12 ASSUMPTIONS
3 EXECUTIVE SUMMARY
4 PREMIUM INSIGHTS
4.1 PRICING ANALYSIS
4.2 IMPORT-EXPORT ANALYSIS (VALUE AND VOLUME)
4.2.1 IMPORT DATA
4.2.2 EXPORT DATA
4.3 ESTIMATED PRODUCTION CONSUMPTION ANALYSIS
5 MARKET OVERVIEW
5.1 DRIVERS
5.1.1 AVAILABILITY OF A WIDE SELECTION OF ICE CREAM FLAVOR POWDER MIXES INCLUDING CHOCOLATE, VANILLA, AND OTHERS
5.1.2 POSITIVE PROGNOSIS FOR THE USE OF DRY ICE CREAM MIXES AT HOME
5.1.3 AN EXPANDING TENDENCY AMONG SMALL-SCALE ICE CREAM MANUFACTURERS TO USE DRY ICE CREAM MIXES
5.2 RESTRAINTS
5.2.1 ICE CREAM DRY MIXES ARE VERY SUSCEPTIBLE TO OXIDATIVE RANCIDITY
5.2.2 PRESENCE OF ARTIFICIAL INGREDIENTS IN ICE CREAM DRY MIXES
5.3 OPPORTUNITIES
5.3.1 EXPANDING PRODUCT VARIETY BY INTRODUCING EXOTIC FLAVORS SUCH AS TROPICAL FRUITS, COCONUTS, AND LEMONS
5.3.2 DEVELOPMENT OF VEGAN AND LACTOSE-FREE ICE CREAM DRY MIXES
5.4 CHALLENGES
5.4.1 HEALTH ISSUES ASSOCIATED WITH THE ICE CREAM CONSUMPTION
5.4.2 FLUCTUATIONS IN RAW MATERIAL PRICES
6 GLOBAL ICE-CREAM DRY MIXES MARKET, BY REGION
6.1 OVERVIEW
6.2 ASIA-PACIFIC
6.2.1 CHINA
6.2.2 INDIA
6.2.3 JAPAN
6.2.4 SOUTH KOREA
6.2.5 AUSTRALIA
6.2.6 INDONESIA
6.2.7 THAILAND
6.2.8 VIETNAM
6.2.9 PHILIPPINES
6.2.10 MALAYSIA
6.2.11 SINGAPORE
6.2.12 REST OF ASIA-PACIFIC
6.3 EUROPE
6.3.1 GERMANY
6.3.2 FRANCE
6.3.3 ITALY
6.3.4 U.K.
6.3.5 SPAIN
6.3.6 RUSSIA
6.3.7 TURKEY
6.3.8 NETHERLANDS
6.3.9 SWITZERLAND
6.3.10 BELGIUM
6.3.11 REST OF EUROPE
6.4 NORTH AMERICA
6.4.1 U.S.
6.4.2 CANADA
6.4.3 MEXICO
6.5 SOUTH AMERICA
6.5.1 BRAZIL
6.5.2 ARGENTINA
6.5.3 REST OF SOUTH AMERICA
6.6 MIDDLE EAST AND AFRICA
6.6.1 SOUTH AFRICA
6.6.2 UNITED ARAB EMIRATES
6.6.3 SAUDI ARABIA
6.6.4 ISRAEL
6.6.5 KUWAIT
6.6.6 EGYPT
6.6.7 REST OF MIDDLE EAST AND AFRICA
7 GLOBAL ICE-CREAM DRY MIXES MARKET: COMPANY LANDSCAPE
7.1 COMPANY SHARE ANALYSIS: GLOBAL
7.2 COMPANY SHARE ANALYSIS: ASIA-PACIFIC
7.3 COMPANY SHARE ANALYSIS: EUROPE
7.4 COMPANY SHARE ANALYSIS: NORTH AMERICA
8 SWOT ANALYSIS
9 COMPANY PROFILES
9.1 SKYLINE FOOD PRODUCTS LLP
9.1.1 COMPANY SNAPSHOT
9.1.2 COMPANY SHARE ANALYSIS
9.1.3 PRODUCT PORTFOLIO
9.1.4 RECENT DEVELOPMENT
9.2 AMBA ENTERPRISE
9.2.1 COMPANY SNAPSHOT
9.2.2 COMPANY SHARE ANALYSIS
9.2.3 PRODUCT PORTFOLIO
9.2.4 RECENT DEVELOPMENT
9.3 WHOLEFARM AUSTRALIA PTY LTD
9.3.1 COMPANY SNAPSHOT
9.3.2 COMPANY SHARE ANALYSIS
9.3.3 PRODUCT PORTFOLIO
9.3.4 RECENT DEVELOPMENT
9.4 TOP CREAMERY
9.4.1 COMPANY SNAPSHOT
9.4.2 COMPANY SHARE ANALYSIS
9.4.3 PRODUCT PORTFOLIO
9.4.4 RECENT DEVELOPMENT
9.5 NIMJE INDUSTRIES
9.5.1 COMPANY SNAPSHOT
9.5.2 COMPANY SHARE ANALYSIS
9.5.3 PRODUCT PORTFOLIO
9.5.4 RECENT DEVELOPMENT
9.6 AMRUT INTERNATIONAL
9.6.1 COMPANY SNAPSHOT
9.6.2 PRODUCT PORTFOLIO
9.6.3 RECENT DEVELOPMENT
9.7 COOKWELLFOODS
9.7.1 COMPANY SNAPSHOT
9.7.2 PRODUCT PORTFOLIO
9.7.3 RECENT DEVELOPMENT
9.8 DESSERTIFY
9.8.1 COMPANY SNAPSHOT
9.8.2 PRODUCT PORTFOLIO
9.8.3 RECENT DEVELOPMENT
9.9 KELLIF'S
9.9.1 COMPANY SNAPSHOT
9.9.2 PRODUCT PORTFOLIO
9.9.3 RECENT DEVELOPMENT
9.1 KWALITY
9.10.1 COMPANY SNAPSHOT
9.10.2 PRODUCT PORTFOLIO
9.10.3 RECENT DEVELOPMENT
9.11 LAKELAND
9.11.1 COMPANY SNAPSHOT
9.11.2 PRODUCT PORTFOLIO
9.11.3 RECENT DEVELOPMENT
9.12 MEADOWVALE
9.12.1 COMPANY SNAPSHOT
9.12.2 PRODUCT PORTFOLIO
9.12.3 RECENT DEVELOPMENT
9.13 MR DEWIE’S CASHEW CREAMERY
9.13.1 COMPANY SNAPSHOT
9.13.2 PRODUCT PORTFOLIO
9.13.3 RECENT DEVELOPMENT
9.14 PHOON HUAT PTE LTD
9.14.1 COMPANY SNAPSHOT
9.14.2 PRODUCT PORTFOLIO
9.14.3 RECENT DEVELOPMENT
9.15 WALNUT CREEK FOODS
9.15.1 COMPANY SNAPSHOT
9.15.2 PRODUCT PORTFOLIO
9.15.3 RECENT DEVELOPMENT
10 QUESTIONNAIRE
11 RELATED REPORTS
List of Table
TABLE 1 IMPORT DATA LIST OF MALT EXTRACT; FOOD PREPARATIONS OF FLOUR, GROATS, MEAL, STARCH OR MALT EXTRACT, ICE CREAM OR MILK MIXES; HS CODE – 190190 (19019003100) (USD THOUSAND)
TABLE 2 IMPORT DATA LIST OF MALT EXTRACT; FOOD PREPARATIONS OF FLOUR, GROATS, MEAL, STARCH OR MALT EXTRACT, ICE CREAM OR MILK MIXES; HS CODE – 190190 (19019003100) (TONS)
TABLE 3 EXPORT DATA LIST OF MALT EXTRACT; FOOD PREPARATIONS OF FLOUR, GROATS, MEAL, STARCH OR MALT EXTRACT, ICE CREAM OR MILK MIXES; HS CODE – 190190 (19019003100) (USD THOUSAND)
TABLE 4 EXPORT DATA LIST OF MALT EXTRACT; FOOD PREPARATIONS OF FLOUR, GROATS, MEAL, STARCH OR MALT EXTRACT, ICE CREAM OR MILK MIXES; HS CODE – 190190 (19019003100) (TONS)
TABLE 5 GLOBAL ICE-CREAM DRY MIXES MARKET, BY REGION, 2021-2030 (USD THOUSAND)
TABLE 6 GLOBAL ICE-CREAM DRY MIXES MARKET, BY REGION, 2021-2030 (TONS)
TABLE 7 GLOBAL ICE-CREAM DRY MIXES MARKET, BY FLAVOR, 2021-2030 (USD THOUSAND)
TABLE 8 GLOBAL ICE-CREAM DRY MIXES MARKET, BY FLAVOR, 2021-2030 (TONS)
TABLE 9 GLOBAL ICE-CREAM DRY MIXES MARKET, BY FLAVOR, 2021-2030 (AVERAGE SELLING PRICE (USD PER KG))
TABLE 10 GLOBAL ICE-CREAM DRY MIXES MARKET, BY CATEGORY, 2021-2030 (USD THOUSAND)
TABLE 11 GLOBAL ICE-CREAM DRY MIXES MARKET, BY END USE, 2021-2030 (USD THOUSAND)
TABLE 12 GLOBAL ICE-CREAM DRY MIXES MARKET, BY PACKAGING MATERIAL, 2021-2030 (USD THOUSAND)
TABLE 13 GLOBAL ICE-CREAM DRY MIXES MARKET, BY PACKAGING TYPE, 2021-2030 (USD THOUSAND)
TABLE 14 GLOBAL ICE-CREAM DRY MIXES MARKET, BY DISTRIBUTION CHANNEL, 2021-2030 (USD THOUSAND)
TABLE 15 GLOBAL B2C IN ICE-CREAM DRY MIXES MARKET, BY CATEGORY, 2021-2030 (USD THOUSAND)
TABLE 16 GLOBAL STORE-BASED RETAILING IN ICE-CREAM DRY MIXES MARKET, BY TYPE, 2021-2030 (USD THOUSAND)
TABLE 17 GLOBAL NON-STORE RETAILING IN ICE-CREAM DRY MIXES MARKET, BY TYPE, 2021-2030 (USD THOUSAND)
TABLE 18 ASIA-PACIFIC ICE-CREAM DRY MIXES MARKET, BY COUNTRY, 2021-2030 (USD THOUSAND)
TABLE 19 ASIA-PACIFIC ICE-CREAM DRY MIXES MARKET, BY COUNTRY, 2021-2030 (TONS)
TABLE 20 ASIA-PACIFIC ICE-CREAM DRY MIXES MARKET, BY FLAVOR, 2021-2030 (USD THOUSAND)
TABLE 21 ASIA-PACIFIC ICE-CREAM DRY MIXES MARKET, BY FLAVOR, 2021-2030 (TONS)
TABLE 22 ASIA-PACIFIC ICE-CREAM DRY MIXES MARKET, BY FLAVOR, 2021-2030 (AVERAGE SELLING PRICE (USD PER KG))
TABLE 23 ASIA-PACIFIC ICE-CREAM DRY MIXES MARKET, BY CATEGORY, 2021-2030 (USD THOUSAND)
TABLE 24 ASIA-PACIFIC ICE-CREAM DRY MIXES MARKET, BY END USE, 2021-2030 (USD THOUSAND)
TABLE 25 ASIA-PACIFIC ICE-CREAM DRY MIXES MARKET, BY PACKAGING MATERIAL, 2021-2030 (USD THOUSAND)
TABLE 26 ASIA-PACIFIC ICE-CREAM DRY MIXES MARKET, BY PACKAGING TYPE, 2021-2030 (USD THOUSAND)
TABLE 27 ASIA-PACIFIC ICE-CREAM DRY MIXES MARKET, BY DISTRIBUTION CHANNEL, 2021-2030 (USD THOUSAND)
TABLE 28 ASIA-PACIFIC B2C IN ICE-CREAM DRY MIXES MARKET, BY CATEGORY, 2021-2030 (USD THOUSAND)
TABLE 29 ASIA-PACIFIC STORE-BASED RETAILING IN ICE-CREAM DRY MIXES MARKET, BY TYPE, 2021-2030 (USD THOUSAND)
TABLE 30 ASIA-PACIFIC NON-STORE RETAILING IN ICE-CREAM DRY MIXES MARKET, BY TYPE, 2021-2030 (USD THOUSAND)
TABLE 31 CHINA ICE-CREAM DRY MIXES MARKET, BY FLAVOR, 2021-2030 (USD THOUSAND)
TABLE 32 CHINA ICE-CREAM DRY MIXES MARKET, BY FLAVOR, 2021-2030 (TONS)
TABLE 33 CHINA ICE-CREAM DRY MIXES MARKET, BY FLAVOR, 2021-2030 (AVERAGE SELLING PRICE (USD PER KG))
TABLE 34 CHINA ICE-CREAM DRY MIXES MARKET, BY CATEGORY, 2021-2030 (USD THOUSAND)
TABLE 35 CHINA ICE-CREAM DRY MIXES MARKET, BY END USE, 2021-2030 (USD THOUSAND)
TABLE 36 CHINA ICE-CREAM DRY MIXES MARKET, BY PACKAGING MATERIAL, 2021-2030 (USD THOUSAND)
TABLE 37 CHINA ICE-CREAM DRY MIXES MARKET, BY PACKAGING TYPE, 2021-2030 (USD THOUSAND)
TABLE 38 CHINA ICE-CREAM DRY MIXES MARKET, BY DISTRIBUTION CHANNEL, 2021-2030 (USD THOUSAND)
TABLE 39 CHINA B2C IN ICE-CREAM DRY MIXES MARKET, BY CATEGORY, 2021-2030 (USD THOUSAND)
TABLE 40 CHINA STORE-BASED RETAILING IN ICE-CREAM DRY MIXES MARKET, BY TYPE, 2021-2030 (USD THOUSAND)
TABLE 41 CHINA NON-STORE RETAILING IN ICE-CREAM DRY MIXES MARKET, BY TYPE, 2021-2030 (USD THOUSAND)
TABLE 42 INDIA ICE-CREAM DRY MIXES MARKET, BY FLAVOR, 2021-2030 (USD THOUSAND)
TABLE 43 INDIA ICE-CREAM DRY MIXES MARKET, BY FLAVOR, 2021-2030 (TONS)
TABLE 44 INDIA ICE-CREAM DRY MIXES MARKET, BY FLAVOR, 2021-2030 (AVERAGE SELLING PRICE (USD PER KG))
TABLE 45 INDIA ICE-CREAM DRY MIXES MARKET, BY CATEGORY, 2021-2030 (USD THOUSAND)
TABLE 46 INDIA ICE-CREAM DRY MIXES MARKET, BY END USE, 2021-2030 (USD THOUSAND)
TABLE 47 INDIA ICE-CREAM DRY MIXES MARKET, BY PACKAGING MATERIAL, 2021-2030 (USD THOUSAND)
TABLE 48 INDIA ICE-CREAM DRY MIXES MARKET, BY PACKAGING TYPE, 2021-2030 (USD THOUSAND)
TABLE 49 INDIA ICE-CREAM DRY MIXES MARKET, BY DISTRIBUTION CHANNEL, 2021-2030 (USD THOUSAND)
TABLE 50 INDIA B2C IN ICE-CREAM DRY MIXES MARKET, BY CATEGORY, 2021-2030 (USD THOUSAND)
TABLE 51 INDIA STORE-BASED RETAILING IN ICE-CREAM DRY MIXES MARKET, BY TYPE, 2021-2030 (USD THOUSAND)
TABLE 52 INDIA NON-STORE RETAILING IN ICE-CREAM DRY MIXES MARKET, BY TYPE, 2021-2030 (USD THOUSAND)
TABLE 53 JAPAN ICE-CREAM DRY MIXES MARKET, BY FLAVOR, 2021-2030 (USD THOUSAND)
TABLE 54 JAPAN ICE-CREAM DRY MIXES MARKET, BY FLAVOR, 2021-2030 (TONS)
TABLE 55 JAPAN ICE-CREAM DRY MIXES MARKET, BY FLAVOR, 2021-2030 (AVERAGE SELLING PRICE (USD PER KG))
TABLE 56 JAPAN ICE-CREAM DRY MIXES MARKET, BY CATEGORY, 2021-2030 (USD THOUSAND)
TABLE 57 JAPAN ICE-CREAM DRY MIXES MARKET, BY END USE, 2021-2030 (USD THOUSAND)
TABLE 58 JAPAN ICE-CREAM DRY MIXES MARKET, BY PACKAGING MATERIAL, 2021-2030 (USD THOUSAND)
TABLE 59 JAPAN ICE-CREAM DRY MIXES MARKET, BY PACKAGING TYPE, 2021-2030 (USD THOUSAND)
TABLE 60 JAPAN ICE-CREAM DRY MIXES MARKET, BY DISTRIBUTION CHANNEL, 2021-2030 (USD THOUSAND)
TABLE 61 JAPAN B2C IN ICE-CREAM DRY MIXES MARKET, BY CATEGORY, 2021-2030 (USD THOUSAND)
TABLE 62 JAPAN STORE-BASED RETAILING IN ICE-CREAM DRY MIXES MARKET, BY TYPE, 2021-2030 (USD THOUSAND)
TABLE 63 JAPAN NON-STORE RETAILING IN ICE-CREAM DRY MIXES MARKET, BY TYPE, 2021-2030 (USD THOUSAND)
TABLE 64 SOUTH KOREA ICE-CREAM DRY MIXES MARKET, BY FLAVOR, 2021-2030 (USD THOUSAND)
TABLE 65 SOUTH KOREA ICE-CREAM DRY MIXES MARKET, BY FLAVOR, 2021-2030 (TONS)
TABLE 66 SOUTH KOREA ICE-CREAM DRY MIXES MARKET, BY FLAVOR, 2021-2030 (AVERAGE SELLING PRICE (USD PER KG))
TABLE 67 SOUTH KOREA ICE-CREAM DRY MIXES MARKET, BY CATEGORY, 2021-2030 (USD THOUSAND)
TABLE 68 SOUTH KOREA ICE-CREAM DRY MIXES MARKET, BY END USE, 2021-2030 (USD THOUSAND)
TABLE 69 SOUTH KOREA ICE-CREAM DRY MIXES MARKET, BY PACKAGING MATERIAL, 2021-2030 (USD THOUSAND)
TABLE 70 SOUTH KOREA ICE-CREAM DRY MIXES MARKET, BY PACKAGING TYPE, 2021-2030 (USD THOUSAND)
TABLE 71 SOUTH KOREA ICE-CREAM DRY MIXES MARKET, BY DISTRIBUTION CHANNEL, 2021-2030 (USD THOUSAND)
TABLE 72 SOUTH KOREA B2C IN ICE-CREAM DRY MIXES MARKET, BY CATEGORY, 2021-2030 (USD THOUSAND)
TABLE 73 SOUTH KOREA STORE-BASED RETAILING IN ICE-CREAM DRY MIXES MARKET, BY TYPE, 2021-2030 (USD THOUSAND)
TABLE 74 SOUTH KOREA NON-STORE RETAILING IN ICE-CREAM DRY MIXES MARKET, BY TYPE, 2021-2030 (USD THOUSAND)
TABLE 75 AUSTRALIA ICE-CREAM DRY MIXES MARKET, BY FLAVOR, 2021-2030 (USD THOUSAND)
TABLE 76 AUSTRALIA ICE-CREAM DRY MIXES MARKET, BY FLAVOR, 2021-2030 (TONS)
TABLE 77 AUSTRALIA ICE-CREAM DRY MIXES MARKET, BY FLAVOR, 2021-2030 (AVERAGE SELLING PRICE (USD PER KG))
TABLE 78 AUSTRALIA ICE-CREAM DRY MIXES MARKET, BY CATEGORY, 2021-2030 (USD THOUSAND)
TABLE 79 AUSTRALIA ICE-CREAM DRY MIXES MARKET, BY END USE, 2021-2030 (USD THOUSAND)
TABLE 80 AUSTRALIA ICE-CREAM DRY MIXES MARKET, BY PACKAGING MATERIAL, 2021-2030 (USD THOUSAND)
TABLE 81 AUSTRALIA ICE-CREAM DRY MIXES MARKET, BY PACKAGING TYPE, 2021-2030 (USD THOUSAND)
TABLE 82 AUSTRALIA ICE-CREAM DRY MIXES MARKET, BY DISTRIBUTION CHANNEL, 2021-2030 (USD THOUSAND)
TABLE 83 AUSTRALIA B2C IN ICE-CREAM DRY MIXES MARKET, BY CATEGORY, 2021-2030 (USD THOUSAND)
TABLE 84 AUSTRALIA STORE-BASED RETAILING IN ICE-CREAM DRY MIXES MARKET, BY TYPE, 2021-2030 (USD THOUSAND)
TABLE 85 AUSTRALIA NON-STORE RETAILING IN ICE-CREAM DRY MIXES MARKET, BY TYPE, 2021-2030 (USD THOUSAND)
TABLE 86 INDONESIA ICE-CREAM DRY MIXES MARKET, BY FLAVOR, 2021-2030 (USD THOUSAND)
TABLE 87 INDONESIA ICE-CREAM DRY MIXES MARKET, BY FLAVOR, 2021-2030 (TONS)
TABLE 88 INDONESIA ICE-CREAM DRY MIXES MARKET, BY FLAVOR, 2021-2030 (AVERAGE SELLING PRICE (USD PER KG))
TABLE 89 INDONESIA ICE-CREAM DRY MIXES MARKET, BY CATEGORY, 2021-2030 (USD THOUSAND)
TABLE 90 INDONESIA ICE-CREAM DRY MIXES MARKET, BY END USE, 2021-2030 (USD THOUSAND)
TABLE 91 INDONESIA ICE-CREAM DRY MIXES MARKET, BY PACKAGING MATERIAL, 2021-2030 (USD THOUSAND)
TABLE 92 INDONESIA ICE-CREAM DRY MIXES MARKET, BY PACKAGING TYPE, 2021-2030 (USD THOUSAND)
TABLE 93 INDONESIA ICE-CREAM DRY MIXES MARKET, BY DISTRIBUTION CHANNEL, 2021-2030 (USD THOUSAND)
TABLE 94 INDONESIA B2C IN ICE-CREAM DRY MIXES MARKET, BY CATEGORY, 2021-2030 (USD THOUSAND)
TABLE 95 INDONESIA STORE-BASED RETAILING IN ICE-CREAM DRY MIXES MARKET, BY TYPE, 2021-2030 (USD THOUSAND)
TABLE 96 INDONESIA NON-STORE RETAILING IN ICE-CREAM DRY MIXES MARKET, BY TYPE, 2021-2030 (USD THOUSAND)
TABLE 97 THAILAND ICE-CREAM DRY MIXES MARKET, BY FLAVOR, 2021-2030 (USD THOUSAND)
TABLE 98 THAILAND ICE-CREAM DRY MIXES MARKET, BY FLAVOR, 2021-2030 (TONS)
TABLE 99 THAILAND ICE-CREAM DRY MIXES MARKET, BY FLAVOR, 2021-2030 (AVERAGE SELLING PRICE (USD PER KG))
TABLE 100 THAILAND ICE-CREAM DRY MIXES MARKET, BY CATEGORY, 2021-2030 (USD THOUSAND)
TABLE 101 THAILAND ICE-CREAM DRY MIXES MARKET, BY END USE, 2021-2030 (USD THOUSAND)
TABLE 102 THAILAND ICE-CREAM DRY MIXES MARKET, BY PACKAGING MATERIAL, 2021-2030 (USD THOUSAND)
TABLE 103 THAILAND ICE-CREAM DRY MIXES MARKET, BY PACKAGING TYPE, 2021-2030 (USD THOUSAND)
TABLE 104 THAILAND ICE-CREAM DRY MIXES MARKET, BY DISTRIBUTION CHANNEL, 2021-2030 (USD THOUSAND)
TABLE 105 THAILAND B2C IN ICE-CREAM DRY MIXES MARKET, BY CATEGORY, 2021-2030 (USD THOUSAND)
TABLE 106 THAILAND STORE-BASED RETAILING IN ICE-CREAM DRY MIXES MARKET, BY TYPE, 2021-2030 (USD THOUSAND)
TABLE 107 THAILAND NON-STORE RETAILING IN ICE-CREAM DRY MIXES MARKET, BY TYPE, 2021-2030 (USD THOUSAND)
TABLE 108 VIETNAM ICE-CREAM DRY MIXES MARKET, BY FLAVOR, 2021-2030 (USD THOUSAND)
TABLE 109 VIETNAM ICE-CREAM DRY MIXES MARKET, BY FLAVOR, 2021-2030 (TONS)
TABLE 110 VIETNAM ICE-CREAM DRY MIXES MARKET, BY FLAVOR, 2021-2030 (AVERAGE SELLING PRICE (USD PER KG))
TABLE 111 VIETNAM ICE-CREAM DRY MIXES MARKET, BY CATEGORY, 2021-2030 (USD THOUSAND)
TABLE 112 VIETNAM ICE-CREAM DRY MIXES MARKET, BY END USE, 2021-2030 (USD THOUSAND)
TABLE 113 VIETNAM ICE-CREAM DRY MIXES MARKET, BY PACKAGING MATERIAL, 2021-2030 (USD THOUSAND)
TABLE 114 VIETNAM ICE-CREAM DRY MIXES MARKET, BY PACKAGING TYPE, 2021-2030 (USD THOUSAND)
TABLE 115 VIETNAM ICE-CREAM DRY MIXES MARKET, BY DISTRIBUTION CHANNEL, 2021-2030 (USD THOUSAND)
TABLE 116 VIETNAM B2C IN ICE-CREAM DRY MIXES MARKET, BY CATEGORY, 2021-2030 (USD THOUSAND)
TABLE 117 VIETNAM STORE-BASED RETAILING IN ICE-CREAM DRY MIXES MARKET, BY TYPE, 2021-2030 (USD THOUSAND)
TABLE 118 VIETNAM NON-STORE RETAILING IN ICE-CREAM DRY MIXES MARKET, BY TYPE, 2021-2030 (USD THOUSAND)
TABLE 119 PHILIPPINES ICE-CREAM DRY MIXES MARKET, BY FLAVOR, 2021-2030 (USD THOUSAND)
TABLE 120 PHILIPPINES ICE-CREAM DRY MIXES MARKET, BY FLAVOR, 2021-2030 (TONS)
TABLE 121 PHILIPPINES ICE-CREAM DRY MIXES MARKET, BY FLAVOR, 2021-2030 (AVERAGE SELLING PRICE (USD PER KG))
TABLE 122 PHILIPPINES ICE-CREAM DRY MIXES MARKET, BY CATEGORY, 2021-2030 (USD THOUSAND)
TABLE 123 PHILIPPINES ICE-CREAM DRY MIXES MARKET, BY END USE, 2021-2030 (USD THOUSAND)
TABLE 124 PHILIPPINES ICE-CREAM DRY MIXES MARKET, BY PACKAGING MATERIAL, 2021-2030 (USD THOUSAND)
TABLE 125 PHILIPPINES ICE-CREAM DRY MIXES MARKET, BY PACKAGING TYPE, 2021-2030 (USD THOUSAND)
TABLE 126 PHILIPPINES ICE-CREAM DRY MIXES MARKET, BY DISTRIBUTION CHANNEL, 2021-2030 (USD THOUSAND)
TABLE 127 PHILIPPINES B2C IN ICE-CREAM DRY MIXES MARKET, BY CATEGORY, 2021-2030 (USD THOUSAND)
TABLE 128 PHILIPPINES STORE-BASED RETAILING IN ICE-CREAM DRY MIXES MARKET, BY TYPE, 2021-2030 (USD THOUSAND)
TABLE 129 PHILIPPINES NON-STORE RETAILING IN ICE-CREAM DRY MIXES MARKET, BY TYPE, 2021-2030 (USD THOUSAND)
TABLE 130 MALAYSIA ICE-CREAM DRY MIXES MARKET, BY FLAVOR, 2021-2030 (USD THOUSAND)
TABLE 131 MALAYSIA ICE-CREAM DRY MIXES MARKET, BY FLAVOR, 2021-2030 (TONS)
TABLE 132 MALAYSIA ICE-CREAM DRY MIXES MARKET, BY FLAVOR, 2021-2030 (AVERAGE SELLING PRICE (USD PER KG))
TABLE 133 MALAYSIA ICE-CREAM DRY MIXES MARKET, BY CATEGORY, 2021-2030 (USD THOUSAND)
TABLE 134 MALAYSIA ICE-CREAM DRY MIXES MARKET, BY END USE, 2021-2030 (USD THOUSAND)
TABLE 135 MALAYSIA ICE-CREAM DRY MIXES MARKET, BY PACKAGING MATERIAL, 2021-2030 (USD THOUSAND)
TABLE 136 MALAYSIA ICE-CREAM DRY MIXES MARKET, BY PACKAGING TYPE, 2021-2030 (USD THOUSAND)
TABLE 137 MALAYSIA ICE-CREAM DRY MIXES MARKET, BY DISTRIBUTION CHANNEL, 2021-2030 (USD THOUSAND)
TABLE 138 MALAYSIA B2C IN ICE-CREAM DRY MIXES MARKET, BY CATEGORY, 2021-2030 (USD THOUSAND)
TABLE 139 MALAYSIA STORE-BASED RETAILING IN ICE-CREAM DRY MIXES MARKET, BY TYPE, 2021-2030 (USD THOUSAND)
TABLE 140 MALAYSIA NON-STORE RETAILING IN ICE-CREAM DRY MIXES MARKET, BY TYPE, 2021-2030 (USD THOUSAND)
TABLE 141 SINGAPORE ICE-CREAM DRY MIXES MARKET, BY FLAVOR, 2021-2030 (USD THOUSAND)
TABLE 142 SINGAPORE ICE-CREAM DRY MIXES MARKET, BY FLAVOR, 2021-2030 (TONS)
TABLE 143 SINGAPORE ICE-CREAM DRY MIXES MARKET, BY FLAVOR, 2021-2030 (AVERAGE SELLING PRICE (USD PER KG))
TABLE 144 SINGAPORE ICE-CREAM DRY MIXES MARKET, BY CATEGORY, 2021-2030 (USD THOUSAND)
TABLE 145 SINGAPORE ICE-CREAM DRY MIXES MARKET, BY END USE, 2021-2030 (USD THOUSAND)
TABLE 146 SINGAPORE ICE-CREAM DRY MIXES MARKET, BY PACKAGING MATERIAL, 2021-2030 (USD THOUSAND)
TABLE 147 SINGAPORE ICE-CREAM DRY MIXES MARKET, BY PACKAGING TYPE, 2021-2030 (USD THOUSAND)
TABLE 148 SINGAPORE ICE-CREAM DRY MIXES MARKET, BY DISTRIBUTION CHANNEL, 2021-2030 (USD THOUSAND)
TABLE 149 SINGAPORE B2C IN ICE-CREAM DRY MIXES MARKET, BY CATEGORY, 2021-2030 (USD THOUSAND)
TABLE 150 SINGAPORE STORE-BASED RETAILING IN ICE-CREAM DRY MIXES MARKET, BY TYPE, 2021-2030 (USD THOUSAND)
TABLE 151 SINGAPORE NON-STORE RETAILING IN ICE-CREAM DRY MIXES MARKET, BY TYPE, 2021-2030 (USD THOUSAND)
TABLE 152 REST OF ASIA-PACIFIC ICE-CREAM DRY MIXES MARKET, BY FLAVOR, 2021-2030 (USD THOUSAND)
TABLE 153 REST OF ASIA-PACIFIC ICE-CREAM DRY MIXES MARKET, BY FLAVOR, 2021-2030 (TONS)
TABLE 154 REST OF ASIA-PACIFIC ICE-CREAM DRY MIXES MARKET, BY FLAVOR, 2021-2030 (AVERAGE SELLING PRICE (USD PER KG))
TABLE 155 EUROPE ICE-CREAM DRY MIXES MARKET, BY COUNTRY, 2021-2030 (USD THOUSAND)
TABLE 156 EUROPE ICE-CREAM DRY MIXES MARKET, BY COUNTRY, 2021-2030 (TONS)
TABLE 157 EUROPE ICE-CREAM DRY MIXES MARKET, BY FLAVOR, 2021-2030 (USD THOUSAND)
TABLE 158 EUROPE ICE-CREAM DRY MIXES MARKET, BY FLAVOR, 2021-2030 (TONS)
TABLE 159 EUROPE ICE-CREAM DRY MIXES MARKET, BY FLAVOR, 2021-2030 (AVERAGE SELLING PRICE (USD PER KG))
TABLE 160 EUROPE ICE-CREAM DRY MIXES MARKET, BY CATEGORY, 2021-2030 (USD THOUSAND)
TABLE 161 EUROPE ICE-CREAM DRY MIXES MARKET, BY END USE, 2021-2030 (USD THOUSAND)
TABLE 162 EUROPE ICE-CREAM DRY MIXES MARKET, BY PACKAGING MATERIAL, 2021-2030 (USD THOUSAND)
TABLE 163 EUROPE ICE-CREAM DRY MIXES MARKET, BY PACKAGING TYPE, 2021-2030 (USD THOUSAND)
TABLE 164 EUROPE ICE-CREAM DRY MIXES MARKET, BY DISTRIBUTION CHANNEL, 2021-2030 (USD THOUSAND)
TABLE 165 EUROPE B2C IN ICE-CREAM DRY MIXES MARKET, BY CATEGORY, 2021-2030 (USD THOUSAND)
TABLE 166 EUROPE STORE-BASED RETAILING IN ICE-CREAM DRY MIXES MARKET, BY TYPE, 2021-2030 (USD THOUSAND)
TABLE 167 EUROPE NON-STORE RETAILING IN ICE-CREAM DRY MIXES MARKET, BY TYPE, 2021-2030 (USD THOUSAND)
TABLE 168 GERMANY ICE-CREAM DRY MIXES MARKET, BY FLAVOR, 2021-2030 (USD THOUSAND)
TABLE 169 GERMANY ICE-CREAM DRY MIXES MARKET, BY FLAVOR, 2021-2030 (TONS)
TABLE 170 GERMANY ICE-CREAM DRY MIXES MARKET, BY FLAVOR, 2021-2030 (AVERAGE SELLING PRICE (USD PER KG))
TABLE 171 GERMANY ICE-CREAM DRY MIXES MARKET, BY CATEGORY, 2021-2030 (USD THOUSAND)
TABLE 172 GERMANY ICE-CREAM DRY MIXES MARKET, BY END USE, 2021-2030 (USD THOUSAND)
TABLE 173 GERMANY ICE-CREAM DRY MIXES MARKET, BY PACKAGING MATERIAL, 2021-2030 (USD THOUSAND)
TABLE 174 GERMANY ICE-CREAM DRY MIXES MARKET, BY PACKAGING TYPE, 2021-2030 (USD THOUSAND)
TABLE 175 GERMANY ICE-CREAM DRY MIXES MARKET, BY DISTRIBUTION CHANNEL, 2021-2030 (USD THOUSAND)
TABLE 176 GERMANY B2C IN ICE-CREAM DRY MIXES MARKET, BY CATEGORY, 2021-2030 (USD THOUSAND)
TABLE 177 GERMANY STORE-BASED RETAILING IN ICE-CREAM DRY MIXES MARKET, BY TYPE, 2021-2030 (USD THOUSAND)
TABLE 178 GERMANY NON-STORE RETAILING IN ICE-CREAM DRY MIXES MARKET, BY TYPE, 2021-2030 (USD THOUSAND)
TABLE 179 FRANCE ICE-CREAM DRY MIXES MARKET, BY FLAVOR, 2021-2030 (USD THOUSAND)
TABLE 180 FRANCE ICE-CREAM DRY MIXES MARKET, BY FLAVOR, 2021-2030 (TONS)
TABLE 181 FRANCE ICE-CREAM DRY MIXES MARKET, BY FLAVOR, 2021-2030 (AVERAGE SELLING PRICE (USD PER KG))
TABLE 182 FRANCE ICE-CREAM DRY MIXES MARKET, BY CATEGORY, 2021-2030 (USD THOUSAND)
TABLE 183 FRANCE ICE-CREAM DRY MIXES MARKET, BY END USE, 2021-2030 (USD THOUSAND)
TABLE 184 FRANCE ICE-CREAM DRY MIXES MARKET, BY PACKAGING MATERIAL, 2021-2030 (USD THOUSAND)
TABLE 185 FRANCE ICE-CREAM DRY MIXES MARKET, BY PACKAGING TYPE, 2021-2030 (USD THOUSAND)
TABLE 186 FRANCE ICE-CREAM DRY MIXES MARKET, BY DISTRIBUTION CHANNEL, 2021-2030 (USD THOUSAND)
TABLE 187 FRANCE B2C IN ICE-CREAM DRY MIXES MARKET, BY CATEGORY, 2021-2030 (USD THOUSAND)
TABLE 188 FRANCE STORE-BASED RETAILING IN ICE-CREAM DRY MIXES MARKET, BY TYPE, 2021-2030 (USD THOUSAND)
TABLE 189 FRANCE NON-STORE RETAILING IN ICE-CREAM DRY MIXES MARKET, BY TYPE, 2021-2030 (USD THOUSAND)
TABLE 190 ITALY ICE-CREAM DRY MIXES MARKET, BY FLAVOR, 2021-2030 (USD THOUSAND)
TABLE 191 ITALY ICE-CREAM DRY MIXES MARKET, BY FLAVOR, 2021-2030 (TONS)
TABLE 192 ITALY ICE-CREAM DRY MIXES MARKET, BY FLAVOR, 2021-2030 (AVERAGE SELLING PRICE (USD PER KG))
TABLE 193 ITALY ICE-CREAM DRY MIXES MARKET, BY CATEGORY, 2021-2030 (USD THOUSAND)
TABLE 194 ITALY ICE-CREAM DRY MIXES MARKET, BY END USE, 2021-2030 (USD THOUSAND)
TABLE 195 ITALY ICE-CREAM DRY MIXES MARKET, BY PACKAGING MATERIAL, 2021-2030 (USD THOUSAND)
TABLE 196 ITALY ICE-CREAM DRY MIXES MARKET, BY PACKAGING TYPE, 2021-2030 (USD THOUSAND)
TABLE 197 ITALY ICE-CREAM DRY MIXES MARKET, BY DISTRIBUTION CHANNEL, 2021-2030 (USD THOUSAND)
TABLE 198 ITALY B2C IN ICE-CREAM DRY MIXES MARKET, BY CATEGORY, 2021-2030 (USD THOUSAND)
TABLE 199 ITALY STORE-BASED RETAILING IN ICE-CREAM DRY MIXES MARKET, BY TYPE, 2021-2030 (USD THOUSAND)
TABLE 200 ITALY NON-STORE RETAILING IN ICE-CREAM DRY MIXES MARKET, BY TYPE, 2021-2030 (USD THOUSAND)
TABLE 201 U.K. ICE-CREAM DRY MIXES MARKET, BY FLAVOR, 2021-2030 (USD THOUSAND)
TABLE 202 U.K. ICE-CREAM DRY MIXES MARKET, BY FLAVOR, 2021-2030 (TONS)
TABLE 203 U.K. ICE-CREAM DRY MIXES MARKET, BY FLAVOR, 2021-2030 (AVERAGE SELLING PRICE (USD PER KG))
TABLE 204 U.K. ICE-CREAM DRY MIXES MARKET, BY CATEGORY, 2021-2030 (USD THOUSAND)
TABLE 205 U.K. ICE-CREAM DRY MIXES MARKET, BY END USE, 2021-2030 (USD THOUSAND)
TABLE 206 U.K. ICE-CREAM DRY MIXES MARKET, BY PACKAGING MATERIAL, 2021-2030 (USD THOUSAND)
TABLE 207 U.K. ICE-CREAM DRY MIXES MARKET, BY PACKAGING TYPE, 2021-2030 (USD THOUSAND)
TABLE 208 U.K. ICE-CREAM DRY MIXES MARKET, BY DISTRIBUTION CHANNEL, 2021-2030 (USD THOUSAND)
TABLE 209 U.K. B2C IN ICE-CREAM DRY MIXES MARKET, BY CATEGORY, 2021-2030 (USD THOUSAND)
TABLE 210 U.K. STORE-BASED RETAILING IN ICE-CREAM DRY MIXES MARKET, BY TYPE, 2021-2030 (USD THOUSAND)
TABLE 211 U.K. NON-STORE RETAILING IN ICE-CREAM DRY MIXES MARKET, BY TYPE, 2021-2030 (USD THOUSAND)
TABLE 212 SPAIN ICE-CREAM DRY MIXES MARKET, BY FLAVOR, 2021-2030 (USD THOUSAND)
TABLE 213 SPAIN ICE-CREAM DRY MIXES MARKET, BY FLAVOR, 2021-2030 (TONS)
TABLE 214 SPAIN ICE-CREAM DRY MIXES MARKET, BY FLAVOR, 2021-2030 (AVERAGE SELLING PRICE (USD PER KG))
TABLE 215 SPAIN ICE-CREAM DRY MIXES MARKET, BY CATEGORY, 2021-2030 (USD THOUSAND)
TABLE 216 SPAIN ICE-CREAM DRY MIXES MARKET, BY END USE, 2021-2030 (USD THOUSAND)
TABLE 217 SPAIN ICE-CREAM DRY MIXES MARKET, BY PACKAGING MATERIAL, 2021-2030 (USD THOUSAND)
TABLE 218 SPAIN ICE-CREAM DRY MIXES MARKET, BY PACKAGING TYPE, 2021-2030 (USD THOUSAND)
TABLE 219 SPAIN ICE-CREAM DRY MIXES MARKET, BY DISTRIBUTION CHANNEL, 2021-2030 (USD THOUSAND)
TABLE 220 SPAIN B2C IN ICE-CREAM DRY MIXES MARKET, BY CATEGORY, 2021-2030 (USD THOUSAND)
TABLE 221 SPAIN STORE-BASED RETAILING IN ICE-CREAM DRY MIXES MARKET, BY TYPE, 2021-2030 (USD THOUSAND)
TABLE 222 SPAIN NON-STORE RETAILING IN ICE-CREAM DRY MIXES MARKET, BY TYPE, 2021-2030 (USD THOUSAND)
TABLE 223 RUSSIA ICE-CREAM DRY MIXES MARKET, BY FLAVOR, 2021-2030 (USD THOUSAND)
TABLE 224 RUSSIA ICE-CREAM DRY MIXES MARKET, BY FLAVOR, 2021-2030 (TONS)
TABLE 225 RUSSIA ICE-CREAM DRY MIXES MARKET, BY FLAVOR, 2021-2030 (AVERAGE SELLING PRICE (USD PER KG))
TABLE 226 RUSSIA ICE-CREAM DRY MIXES MARKET, BY CATEGORY, 2021-2030 (USD THOUSAND)
TABLE 227 RUSSIA ICE-CREAM DRY MIXES MARKET, BY END USE, 2021-2030 (USD THOUSAND)
TABLE 228 RUSSIA ICE-CREAM DRY MIXES MARKET, BY PACKAGING MATERIAL, 2021-2030 (USD THOUSAND)
TABLE 229 RUSSIA ICE-CREAM DRY MIXES MARKET, BY PACKAGING TYPE, 2021-2030 (USD THOUSAND)
TABLE 230 RUSSIA ICE-CREAM DRY MIXES MARKET, BY DISTRIBUTION CHANNEL, 2021-2030 (USD THOUSAND)
TABLE 231 RUSSIA B2C IN ICE-CREAM DRY MIXES MARKET, BY CATEGORY, 2021-2030 (USD THOUSAND)
TABLE 232 RUSSIA STORE-BASED RETAILING IN ICE-CREAM DRY MIXES MARKET, BY TYPE, 2021-2030 (USD THOUSAND)
TABLE 233 RUSSIA NON-STORE RETAILING IN ICE-CREAM DRY MIXES MARKET, BY TYPE, 2021-2030 (USD THOUSAND)
TABLE 234 TURKEY ICE-CREAM DRY MIXES MARKET, BY FLAVOR, 2021-2030 (USD THOUSAND)
TABLE 235 TURKEY ICE-CREAM DRY MIXES MARKET, BY FLAVOR, 2021-2030 (TONS)
TABLE 236 TURKEY ICE-CREAM DRY MIXES MARKET, BY FLAVOR, 2021-2030 (AVERAGE SELLING PRICE (USD PER KG))
TABLE 237 TURKEY ICE-CREAM DRY MIXES MARKET, BY CATEGORY, 2021-2030 (USD THOUSAND)
TABLE 238 TURKEY ICE-CREAM DRY MIXES MARKET, BY END USE, 2021-2030 (USD THOUSAND)
TABLE 239 TURKEY ICE-CREAM DRY MIXES MARKET, BY PACKAGING MATERIAL, 2021-2030 (USD THOUSAND)
TABLE 240 TURKEY ICE-CREAM DRY MIXES MARKET, BY PACKAGING TYPE, 2021-2030 (USD THOUSAND)
TABLE 241 TURKEY ICE-CREAM DRY MIXES MARKET, BY DISTRIBUTION CHANNEL, 2021-2030 (USD THOUSAND)
TABLE 242 TURKEY B2C IN ICE-CREAM DRY MIXES MARKET, BY CATEGORY, 2021-2030 (USD THOUSAND)
TABLE 243 TURKEY STORE-BASED RETAILING IN ICE-CREAM DRY MIXES MARKET, BY TYPE, 2021-2030 (USD THOUSAND)
TABLE 244 TURKEY NON-STORE RETAILING IN ICE-CREAM DRY MIXES MARKET, BY TYPE, 2021-2030 (USD THOUSAND)
TABLE 245 NETHERLANDS ICE-CREAM DRY MIXES MARKET, BY FLAVOR, 2021-2030 (USD THOUSAND)
TABLE 246 NETHERLANDS ICE-CREAM DRY MIXES MARKET, BY FLAVOR, 2021-2030 (TONS)
TABLE 247 NETHERLANDS ICE-CREAM DRY MIXES MARKET, BY FLAVOR, 2021-2030 (AVERAGE SELLING PRICE (USD PER KG))
TABLE 248 NETHERLANDS ICE-CREAM DRY MIXES MARKET, BY CATEGORY, 2021-2030 (USD THOUSAND)
TABLE 249 NETHERLANDS ICE-CREAM DRY MIXES MARKET, BY END USE, 2021-2030 (USD THOUSAND)
TABLE 250 NETHERLANDS ICE-CREAM DRY MIXES MARKET, BY PACKAGING MATERIAL, 2021-2030 (USD THOUSAND)
TABLE 251 NETHERLANDS ICE-CREAM DRY MIXES MARKET, BY PACKAGING TYPE, 2021-2030 (USD THOUSAND)
TABLE 252 NETHERLANDS ICE-CREAM DRY MIXES MARKET, BY DISTRIBUTION CHANNEL, 2021-2030 (USD THOUSAND)
TABLE 253 NETHERLANDS B2C IN ICE-CREAM DRY MIXES MARKET, BY CATEGORY, 2021-2030 (USD THOUSAND)
TABLE 254 NETHERLANDS STORE-BASED RETAILING IN ICE-CREAM DRY MIXES MARKET, BY TYPE, 2021-2030 (USD THOUSAND)
TABLE 255 NETHERLANDS NON-STORE RETAILING IN ICE-CREAM DRY MIXES MARKET, BY TYPE, 2021-2030 (USD THOUSAND)
TABLE 256 SWITZERLAND ICE-CREAM DRY MIXES MARKET, BY FLAVOR, 2021-2030 (USD THOUSAND)
TABLE 257 SWITZERLAND ICE-CREAM DRY MIXES MARKET, BY FLAVOR, 2021-2030 (TONS)
TABLE 258 SWITZERLAND ICE-CREAM DRY MIXES MARKET, BY FLAVOR, 2021-2030 (AVERAGE SELLING PRICE (USD PER KG))
TABLE 259 SWITZERLAND ICE-CREAM DRY MIXES MARKET, BY CATEGORY, 2021-2030 (USD THOUSAND)
TABLE 260 SWITZERLAND ICE-CREAM DRY MIXES MARKET, BY END USE, 2021-2030 (USD THOUSAND)
TABLE 261 SWITZERLAND ICE-CREAM DRY MIXES MARKET, BY PACKAGING MATERIAL, 2021-2030 (USD THOUSAND)
TABLE 262 SWITZERLAND ICE-CREAM DRY MIXES MARKET, BY PACKAGING TYPE, 2021-2030 (USD THOUSAND)
TABLE 263 SWITZERLAND ICE-CREAM DRY MIXES MARKET, BY DISTRIBUTION CHANNEL, 2021-2030 (USD THOUSAND)
TABLE 264 SWITZERLAND B2C IN ICE-CREAM DRY MIXES MARKET, BY CATEGORY, 2021-2030 (USD THOUSAND)
TABLE 265 SWITZERLAND STORE-BASED RETAILING IN ICE-CREAM DRY MIXES MARKET, BY TYPE, 2021-2030 (USD THOUSAND)
TABLE 266 SWITZERLAND NON-STORE RETAILING IN ICE-CREAM DRY MIXES MARKET, BY TYPE, 2021-2030 (USD THOUSAND)
TABLE 267 BELGIUM ICE-CREAM DRY MIXES MARKET, BY FLAVOR, 2021-2030 (USD THOUSAND)
TABLE 268 BELGIUM ICE-CREAM DRY MIXES MARKET, BY FLAVOR, 2021-2030 (TONS)
TABLE 269 BELGIUM ICE-CREAM DRY MIXES MARKET, BY FLAVOR, 2021-2030 (AVERAGE SELLING PRICE (USD PER KG))
TABLE 270 BELGIUM ICE-CREAM DRY MIXES MARKET, BY CATEGORY, 2021-2030 (USD THOUSAND)
TABLE 271 BELGIUM ICE-CREAM DRY MIXES MARKET, BY END USE, 2021-2030 (USD THOUSAND)
TABLE 272 BELGIUM ICE-CREAM DRY MIXES MARKET, BY PACKAGING MATERIAL, 2021-2030 (USD THOUSAND)
TABLE 273 BELGIUM ICE-CREAM DRY MIXES MARKET, BY PACKAGING TYPE, 2021-2030 (USD THOUSAND)
TABLE 274 BELGIUM ICE-CREAM DRY MIXES MARKET, BY DISTRIBUTION CHANNEL, 2021-2030 (USD THOUSAND)
TABLE 275 BELGIUM B2C IN ICE-CREAM DRY MIXES MARKET, BY CATEGORY, 2021-2030 (USD THOUSAND)
TABLE 276 BELGIUM STORE-BASED RETAILING IN ICE-CREAM DRY MIXES MARKET, BY TYPE, 2021-2030 (USD THOUSAND)
TABLE 277 BELGIUM NON-STORE RETAILING IN ICE-CREAM DRY MIXES MARKET, BY TYPE, 2021-2030 (USD THOUSAND)
TABLE 278 REST OF EUROPE ICE-CREAM DRY MIXES MARKET, BY FLAVOR, 2021-2030 (USD THOUSAND)
TABLE 279 REST OF EUROPE ICE-CREAM DRY MIXES MARKET, BY FLAVOR, 2021-2030 (TONS)
TABLE 280 REST OF EUROPE ICE-CREAM DRY MIXES MARKET, BY FLAVOR, 2021-2030 (AVERAGE SELLING PRICE (USD PER KG))
TABLE 281 NORTH AMERICA ICE-CREAM DRY MIXES MARKET, BY COUNTRY, 2021-2030 (USD THOUSAND)
TABLE 282 NORTH AMERICA ICE-CREAM DRY MIXES MARKET, BY COUNTRY, 2021-2030 (TONS)
TABLE 283 NORTH AMERICA ICE-CREAM DRY MIXES MARKET, BY FLAVOR, 2021-2030 (USD THOUSAND)
TABLE 284 NORTH AMERICA ICE-CREAM DRY MIXES MARKET, BY FLAVOR, 2021-2030 (TONS)
TABLE 285 NORTH AMERICA ICE-CREAM DRY MIXES MARKET, BY FLAVOR, 2021-2030 (AVERAGE SELLING PRICE (USD PER KG))
TABLE 286 NORTH AMERICA ICE-CREAM DRY MIXES MARKET, BY CATEGORY, 2021-2030 (USD THOUSAND)
TABLE 287 NORTH AMERICA ICE-CREAM DRY MIXES MARKET, BY END USE, 2021-2030 (USD THOUSAND)
TABLE 288 NORTH AMERICA ICE-CREAM DRY MIXES MARKET, BY PACKAGING MATERIAL, 2021-2030 (USD THOUSAND)
TABLE 289 NORTH AMERICA ICE-CREAM DRY MIXES MARKET, BY PACKAGING TYPE, 2021-2030 (USD THOUSAND)
TABLE 290 NORTH AMERICA ICE-CREAM DRY MIXES MARKET, BY DISTRIBUTION CHANNEL, 2021-2030 (USD THOUSAND)
TABLE 291 NORTH AMERICA B2C IN ICE-CREAM DRY MIXES MARKET, BY CATEGORY, 2021-2030 (USD THOUSAND)
TABLE 292 NORTH AMERICA STORE-BASED RETAILING IN ICE-CREAM DRY MIXES MARKET, BY TYPE, 2021-2030 (USD THOUSAND)
TABLE 293 NORTH AMERICA NON-STORE RETAILING IN ICE-CREAM DRY MIXES MARKET, BY TYPE, 2021-2030 (USD THOUSAND)
TABLE 294 U.S. ICE-CREAM DRY MIXES MARKET, BY FLAVOR, 2021-2030 (USD THOUSAND)
TABLE 295 U.S. ICE-CREAM DRY MIXES MARKET, BY FLAVOR, 2021-2030 (TONS)
TABLE 296 U.S. ICE-CREAM DRY MIXES MARKET, BY FLAVOR, 2021-2030 (AVERAGE SELLING PRICE (USD PER KG))
TABLE 297 U.S. ICE-CREAM DRY MIXES MARKET, BY CATEGORY, 2021-2030 (USD THOUSAND)
TABLE 298 U.S. ICE-CREAM DRY MIXES MARKET, BY END USE, 2021-2030 (USD THOUSAND)
TABLE 299 U.S. ICE-CREAM DRY MIXES MARKET, BY PACKAGING MATERIAL, 2021-2030 (USD THOUSAND)
TABLE 300 U.S. ICE-CREAM DRY MIXES MARKET, BY PACKAGING TYPE, 2021-2030 (USD THOUSAND)
TABLE 301 U.S. ICE-CREAM DRY MIXES MARKET, BY DISTRIBUTION CHANNEL, 2021-2030 (USD THOUSAND)
TABLE 302 U.S. B2C IN ICE-CREAM DRY MIXES MARKET, BY CATEGORY, 2021-2030 (USD THOUSAND)
TABLE 303 U.S. STORE-BASED RETAILING IN ICE-CREAM DRY MIXES MARKET, BY TYPE, 2021-2030 (USD THOUSAND)
TABLE 304 U.S. NON-STORE RETAILING IN ICE-CREAM DRY MIXES MARKET, BY TYPE, 2021-2030 (USD THOUSAND)
TABLE 305 CANADA ICE-CREAM DRY MIXES MARKET, BY FLAVOR, 2021-2030 (USD THOUSAND)
TABLE 306 CANADA ICE-CREAM DRY MIXES MARKET, BY FLAVOR, 2021-2030 (TONS)
TABLE 307 CANADA ICE-CREAM DRY MIXES MARKET, BY FLAVOR, 2021-2030 (AVERAGE SELLING PRICE (USD PER KG))
TABLE 308 CANADA ICE-CREAM DRY MIXES MARKET, BY CATEGORY, 2021-2030 (USD THOUSAND)
TABLE 309 CANADA ICE-CREAM DRY MIXES MARKET, BY END USE, 2021-2030 (USD THOUSAND)
TABLE 310 CANADA ICE-CREAM DRY MIXES MARKET, BY PACKAGING MATERIAL, 2021-2030 (USD THOUSAND)
TABLE 311 CANADA ICE-CREAM DRY MIXES MARKET, BY PACKAGING TYPE, 2021-2030 (USD THOUSAND)
TABLE 312 CANADA ICE-CREAM DRY MIXES MARKET, BY DISTRIBUTION CHANNEL, 2021-2030 (USD THOUSAND)
TABLE 313 CANADA B2C IN ICE-CREAM DRY MIXES MARKET, BY CATEGORY, 2021-2030 (USD THOUSAND)
TABLE 314 CANADA STORE-BASED RETAILING IN ICE-CREAM DRY MIXES MARKET, BY TYPE, 2021-2030 (USD THOUSAND)
TABLE 315 CANADA NON-STORE RETAILING IN ICE-CREAM DRY MIXES MARKET, BY TYPE, 2021-2030 (USD THOUSAND)
TABLE 316 MEXICO ICE-CREAM DRY MIXES MARKET, BY FLAVOR, 2021-2030 (USD THOUSAND)
TABLE 317 MEXICO ICE-CREAM DRY MIXES MARKET, BY FLAVOR, 2021-2030 (TONS)
TABLE 318 MEXICO ICE-CREAM DRY MIXES MARKET, BY FLAVOR, 2021-2030 (AVERAGE SELLING PRICE (USD PER KG))
TABLE 319 MEXICO ICE-CREAM DRY MIXES MARKET, BY CATEGORY, 2021-2030 (USD THOUSAND)
TABLE 320 MEXICO ICE-CREAM DRY MIXES MARKET, BY END USE, 2021-2030 (USD THOUSAND)
TABLE 321 MEXICO ICE-CREAM DRY MIXES MARKET, BY PACKAGING MATERIAL, 2021-2030 (USD THOUSAND)
TABLE 322 MEXICO ICE-CREAM DRY MIXES MARKET, BY PACKAGING TYPE, 2021-2030 (USD THOUSAND)
TABLE 323 MEXICO ICE-CREAM DRY MIXES MARKET, BY DISTRIBUTION CHANNEL, 2021-2030 (USD THOUSAND)
TABLE 324 MEXICO B2C IN ICE-CREAM DRY MIXES MARKET, BY CATEGORY, 2021-2030 (USD THOUSAND)
TABLE 325 MEXICO STORE-BASED RETAILING IN ICE-CREAM DRY MIXES MARKET, BY TYPE, 2021-2030 (USD THOUSAND)
TABLE 326 MEXICO NON-STORE RETAILING IN ICE-CREAM DRY MIXES MARKET, BY TYPE, 2021-2030 (USD THOUSAND)
TABLE 327 SOUTH AMERICA ICE-CREAM DRY MIXES MARKET, BY COUNTRY, 2021-2030 (USD THOUSAND)
TABLE 328 SOUTH AMERICA ICE-CREAM DRY MIXES MARKET, BY COUNTRY, 2021-2030 (TONS)
TABLE 329 SOUTH AMERICA ICE-CREAM DRY MIXES MARKET, BY FLAVOR, 2021-2030 (USD THOUSAND)
TABLE 330 SOUTH AMERICA ICE-CREAM DRY MIXES MARKET, BY FLAVOR, 2021-2030 (TONS)
TABLE 331 SOUTH AMERICA ICE-CREAM DRY MIXES MARKET, BY FLAVOR, 2021-2030 (AVERAGE SELLING PRICE (USD PER KG))
TABLE 332 SOUTH AMERICA ICE-CREAM DRY MIXES MARKET, BY CATEGORY, 2021-2030 (USD THOUSAND)
TABLE 333 SOUTH AMERICA ICE-CREAM DRY MIXES MARKET, BY END USE, 2021-2030 (USD THOUSAND)
TABLE 334 SOUTH AMERICA ICE-CREAM DRY MIXES MARKET, BY PACKAGING MATERIAL, 2021-2030 (USD THOUSAND)
TABLE 335 SOUTH AMERICA ICE-CREAM DRY MIXES MARKET, BY PACKAGING TYPE, 2021-2030 (USD THOUSAND)
TABLE 336 SOUTH AMERICA ICE-CREAM DRY MIXES MARKET, BY DISTRIBUTION CHANNEL, 2021-2030 (USD THOUSAND)
TABLE 337 SOUTH AMERICA B2C IN ICE-CREAM DRY MIXES MARKET, BY CATEGORY, 2021-2030 (USD THOUSAND)
TABLE 338 SOUTH AMERICA STORE-BASED RETAILING IN ICE-CREAM DRY MIXES MARKET, BY TYPE, 2021-2030 (USD THOUSAND)
TABLE 339 SOUTH AMERICA NON-STORE RETAILING IN ICE-CREAM DRY MIXES MARKET, BY TYPE, 2021-2030 (USD THOUSAND)
TABLE 340 BRAZIL ICE-CREAM DRY MIXES MARKET, BY FLAVOR, 2021-2030 (USD THOUSAND)
TABLE 341 BRAZIL ICE-CREAM DRY MIXES MARKET, BY FLAVOR, 2021-2030 (TONS)
TABLE 342 BRAZIL ICE-CREAM DRY MIXES MARKET, BY FLAVOR, 2021-2030 (AVERAGE SELLING PRICE (USD PER KG))
TABLE 343 BRAZIL ICE-CREAM DRY MIXES MARKET, BY CATEGORY, 2021-2030 (USD THOUSAND)
TABLE 344 BRAZIL ICE-CREAM DRY MIXES MARKET, BY END USE, 2021-2030 (USD THOUSAND)
TABLE 345 BRAZIL ICE-CREAM DRY MIXES MARKET, BY PACKAGING MATERIAL, 2021-2030 (USD THOUSAND)
TABLE 346 BRAZIL ICE-CREAM DRY MIXES MARKET, BY PACKAGING TYPE, 2021-2030 (USD THOUSAND)
TABLE 347 BRAZIL ICE-CREAM DRY MIXES MARKET, BY DISTRIBUTION CHANNEL, 2021-2030 (USD THOUSAND)
TABLE 348 BRAZIL B2C IN ICE-CREAM DRY MIXES MARKET, BY CATEGORY, 2021-2030 (USD THOUSAND)
TABLE 349 BRAZIL STORE-BASED RETAILING IN ICE-CREAM DRY MIXES MARKET, BY TYPE, 2021-2030 (USD THOUSAND)
TABLE 350 BRAZIL NON-STORE RETAILING IN ICE-CREAM DRY MIXES MARKET, BY TYPE, 2021-2030 (USD THOUSAND)
TABLE 351 ARGENTINA ICE-CREAM DRY MIXES MARKET, BY FLAVOR, 2021-2030 (USD THOUSAND)
TABLE 352 ARGENTINA ICE-CREAM DRY MIXES MARKET, BY FLAVOR, 2021-2030 (TONS)
TABLE 353 ARGENTINA ICE-CREAM DRY MIXES MARKET, BY FLAVOR, 2021-2030 (AVERAGE SELLING PRICE (USD PER KG))
TABLE 354 ARGENTINA ICE-CREAM DRY MIXES MARKET, BY CATEGORY, 2021-2030 (USD THOUSAND)
TABLE 355 ARGENTINA ICE-CREAM DRY MIXES MARKET, BY END USE, 2021-2030 (USD THOUSAND)
TABLE 356 ARGENTINA ICE-CREAM DRY MIXES MARKET, BY PACKAGING MATERIAL, 2021-2030 (USD THOUSAND)
TABLE 357 ARGENTINA ICE-CREAM DRY MIXES MARKET, BY PACKAGING TYPE, 2021-2030 (USD THOUSAND)
TABLE 358 ARGENTINA ICE-CREAM DRY MIXES MARKET, BY DISTRIBUTION CHANNEL, 2021-2030 (USD THOUSAND)
TABLE 359 ARGENTINA B2C IN ICE-CREAM DRY MIXES MARKET, BY CATEGORY, 2021-2030 (USD THOUSAND)
TABLE 360 ARGENTINA STORE-BASED RETAILING IN ICE-CREAM DRY MIXES MARKET, BY TYPE, 2021-2030 (USD THOUSAND)
TABLE 361 ARGENTINA NON-STORE RETAILING IN ICE-CREAM DRY MIXES MARKET, BY TYPE, 2021-2030 (USD THOUSAND)
TABLE 362 REST OF SOUTH AMERICA ICE-CREAM DRY MIXES MARKET, BY FLAVOR, 2021-2030 (USD THOUSAND)
TABLE 363 REST OF SOUTH AMERICA ICE-CREAM DRY MIXES MARKET, BY FLAVOR, 2021-2030 (TONS)
TABLE 364 REST OF SOUTH AMERICA ICE-CREAM DRY MIXES MARKET, BY FLAVOR, 2021-2030 (AVERAGE SELLING PRICE (USD PER KG))
TABLE 365 MIDDLE EAST AND AFRICA ICE-CREAM DRY MIXES MARKET, BY COUNTRY, 2021-2030 (THOUSAND)
TABLE 366 MIDDLE EAST AND AFRICA ICE-CREAM DRY MIXES MARKET, BY COUNTRY, 2021-2030 (TONS)
TABLE 367 MIDDLE EAST AND AFRICA ICE-CREAM DRY MIXES MARKET, BY FLAVOR, 2021-2030 (USD THOUSAND)
TABLE 368 MIDDLE EAST AND AFRICA ICE-CREAM DRY MIXES MARKET, BY FLAVOR, 2021-2030 (TONS)
TABLE 369 MIDDLE EAST AND AFRICA ICE-CREAM DRY MIXES MARKET, BY FLAVOR, 2021-2030 (AVERAGE SELLING PRICE (USD PER KG))
TABLE 370 MIDDLE EAST AND AFRICA ICE-CREAM DRY MIXES MARKET, BY CATEGORY, 2021-2030 (USD THOUSAND)
TABLE 371 MIDDLE EAST AND AFRICA ICE-CREAM DRY MIXES MARKET, BY END USE, 2021-2030 (USD THOUSAND)
TABLE 372 MIDDLE EAST AND AFRICA ICE-CREAM DRY MIXES MARKET, BY PACKAGING MATERIAL, 2021-2030 (USD THOUSAND)
TABLE 373 MIDDLE EAST AND AFRICA ICE-CREAM DRY MIXES MARKET, BY PACKAGING TYPE, 2021-2030 (USD THOUSAND)
TABLE 374 MIDDLE EAST AND AFRICA ICE-CREAM DRY MIXES MARKET, BY DISTRIBUTION CHANNEL, 2021-2030 (USD THOUSAND)
TABLE 375 MIDDLE EAST AND AFRICA B2C IN ICE-CREAM DRY MIXES MARKET, BY CATEGORY, 2021-2030 (USD THOUSAND)
TABLE 376 MIDDLE EAST AND AFRICA STORE-BASED RETAILING IN ICE-CREAM DRY MIXES MARKET, BY TYPE, 2021-2030 (USD THOUSAND)
TABLE 377 MIDDLE EAST AND AFRICA NON-STORE RETAILING IN ICE-CREAM DRY MIXES MARKET, BY TYPE, 2021-2030 (USD THOUSAND)
TABLE 378 SOUTH AFRICA ICE-CREAM DRY MIXES MARKET, BY FLAVOR, 2021-2030 (THOUSAND)
TABLE 379 SOUTH AFRICA ICE-CREAM DRY MIXES MARKET, BY FLAVOR, 2021-2030 (TONS)
TABLE 380 SOUTH AFRICA ICE-CREAM DRY MIXES MARKET, BY FLAVOR, 2021-2030 (AVERAGE SELLING PRICE (USD PER KG))
TABLE 381 SOUTH AFRICA ICE-CREAM DRY MIXES MARKET, BY CATEGORY, 2021-2030 (USD THOUSAND)
TABLE 382 SOUTH AFRICA ICE-CREAM DRY MIXES MARKET, BY END USE, 2021-2030 (USD THOUSAND)
TABLE 383 SOUTH AFRICA ICE-CREAM DRY MIXES MARKET, BY PACKAGING MATERIAL, 2021-2030 (USD THOUSAND)
TABLE 384 SOUTH AFRICA ICE-CREAM DRY MIXES MARKET, BY PACKAGING TYPE, 2021-2030 (USD THOUSAND)
TABLE 385 SOUTH AFRICA ICE-CREAM DRY MIXES MARKET, BY DISTRIBUTION CHANNEL, 2021-2030 (USD THOUSAND)
TABLE 386 SOUTH AFRICA B2C IN ICE-CREAM DRY MIXES MARKET, BY CATEGORY, 2021-2030 (USD THOUSAND)
TABLE 387 SOUTH AFRICA STORE-BASED RETAILING IN ICE-CREAM DRY MIXES MARKET, BY TYPE, 2021-2030 (USD THOUSAND)
TABLE 388 SOUTH AFRICA NON-STORE RETAILING IN ICE-CREAM DRY MIXES MARKET, BY TYPE, 2021-2030 (USD THOUSAND)
TABLE 389 UNITED ARAB EMIRATES ICE-CREAM DRY MIXES MARKET, BY FLAVOR, 2021-2030 (THOUSAND)
TABLE 390 UNITED ARAB EMIRATES ICE-CREAM DRY MIXES MARKET, BY FLAVOR, 2021-2030 (TONS)
TABLE 391 UNITED ARAB EMIRATES ICE-CREAM DRY MIXES MARKET, BY FLAVOR, 2021-2030 (AVERAGE SELLING PRICE (USD PER KG))
TABLE 392 UNITED ARAB EMIRATES ICE-CREAM DRY MIXES MARKET, BY CATEGORY, 2021-2030 (USD THOUSAND)
TABLE 393 UNITED ARAB EMIRATES ICE-CREAM DRY MIXES MARKET, BY END USE, 2021-2030 (USD THOUSAND)
TABLE 394 UNITED ARAB EMIRATES ICE-CREAM DRY MIXES MARKET, BY PACKAGING MATERIAL, 2021-2030 (USD THOUSAND)
TABLE 395 UNITED ARAB EMIRATES ICE-CREAM DRY MIXES MARKET, BY PACKAGING TYPE, 2021-2030 (USD THOUSAND)
TABLE 396 UNITED ARAB EMIRATES ICE-CREAM DRY MIXES MARKET, BY DISTRIBUTION CHANNEL, 2021-2030 (USD THOUSAND)
TABLE 397 UNITED ARAB EMIRATES B2C IN ICE-CREAM DRY MIXES MARKET, BY CATEGORY, 2021-2030 (USD THOUSAND)
TABLE 398 UNITED ARAB EMIRATES STORE-BASED RETAILING IN ICE-CREAM DRY MIXES MARKET, BY TYPE, 2021-2030 (USD THOUSAND)
TABLE 399 UNITED ARAB EMIRATES NON-STORE RETAILING IN ICE-CREAM DRY MIXES MARKET, BY TYPE, 2021-2030 (USD THOUSAND)
TABLE 400 SAUDI ARABIA ICE-CREAM DRY MIXES MARKET, BY FLAVOR, 2021-2030 (THOUSAND)
TABLE 401 SAUDI ARABIA ICE-CREAM DRY MIXES MARKET, BY FLAVOR, 2021-2030 (TONS)
TABLE 402 SAUDI ARABIA ICE-CREAM DRY MIXES MARKET, BY FLAVOR, 2021-2030 (AVERAGE SELLING PRICE (USD PER KG))
TABLE 403 SAUDI ARABIA ICE-CREAM DRY MIXES MARKET, BY CATEGORY, 2021-2030 (USD THOUSAND)
TABLE 404 SAUDI ARABIA ICE-CREAM DRY MIXES MARKET, BY END USE, 2021-2030 (USD THOUSAND)
TABLE 405 SAUDI ARABIA ICE-CREAM DRY MIXES MARKET, BY PACKAGING MATERIAL, 2021-2030 (USD THOUSAND)
TABLE 406 SAUDI ARABIA ICE-CREAM DRY MIXES MARKET, BY PACKAGING TYPE, 2021-2030 (USD THOUSAND)
TABLE 407 SAUDI ARABIA ICE-CREAM DRY MIXES MARKET, BY DISTRIBUTION CHANNEL, 2021-2030 (USD THOUSAND)
TABLE 408 SAUDI ARABIA B2C IN ICE-CREAM DRY MIXES MARKET, BY CATEGORY, 2021-2030 (USD THOUSAND)
TABLE 409 SAUDI ARABIA STORE-BASED RETAILING IN ICE-CREAM DRY MIXES MARKET, BY TYPE, 2021-2030 (USD THOUSAND)
TABLE 410 SAUDI ARABIA NON-STORE RETAILING IN ICE-CREAM DRY MIXES MARKET, BY TYPE, 2021-2030 (USD THOUSAND)
TABLE 411 ISRAEL ICE-CREAM DRY MIXES MARKET, BY FLAVOR, 2021-2030 (THOUSAND)
TABLE 412 ISRAEL ICE-CREAM DRY MIXES MARKET, BY FLAVOR, 2021-2030 (TONS)
TABLE 413 ISRAEL ICE-CREAM DRY MIXES MARKET, BY FLAVOR, 2021-2030 (AVERAGE SELLING PRICE (USD PER KG))
TABLE 414 ISRAEL ICE-CREAM DRY MIXES MARKET, BY CATEGORY, 2021-2030 (USD THOUSAND)
TABLE 415 ISRAEL ICE-CREAM DRY MIXES MARKET, BY END USE, 2021-2030 (USD THOUSAND)
TABLE 416 ISRAEL ICE-CREAM DRY MIXES MARKET, BY PACKAGING MATERIAL, 2021-2030 (USD THOUSAND)
TABLE 417 ISRAEL ICE-CREAM DRY MIXES MARKET, BY PACKAGING TYPE, 2021-2030 (USD THOUSAND)
TABLE 418 ISRAEL ICE-CREAM DRY MIXES MARKET, BY DISTRIBUTION CHANNEL, 2021-2030 (USD THOUSAND)
TABLE 419 ISRAEL B2C IN ICE-CREAM DRY MIXES MARKET, BY CATEGORY, 2021-2030 (USD THOUSAND)
TABLE 420 ISRAEL STORE-BASED RETAILING IN ICE-CREAM DRY MIXES MARKET, BY TYPE, 2021-2030 (USD THOUSAND)
TABLE 421 ISRAEL NON-STORE RETAILING IN ICE-CREAM DRY MIXES MARKET, BY TYPE, 2021-2030 (USD THOUSAND)
TABLE 422 KUWAIT ICE-CREAM DRY MIXES MARKET, BY FLAVOR, 2021-2030 (THOUSAND)
TABLE 423 KUWAIT ICE-CREAM DRY MIXES MARKET, BY FLAVOR, 2021-2030 (TONS)
TABLE 424 KUWAIT ICE-CREAM DRY MIXES MARKET, BY FLAVOR, 2021-2030 (AVERAGE SELLING PRICE (USD PER KG))
TABLE 425 KUWAIT ICE-CREAM DRY MIXES MARKET, BY CATEGORY, 2021-2030 (USD THOUSAND)
TABLE 426 KUWAIT ICE-CREAM DRY MIXES MARKET, BY END USE, 2021-2030 (USD THOUSAND)
TABLE 427 KUWAIT ICE-CREAM DRY MIXES MARKET, BY PACKAGING MATERIAL, 2021-2030 (USD THOUSAND)
TABLE 428 KUWAIT ICE-CREAM DRY MIXES MARKET, BY PACKAGING TYPE, 2021-2030 (USD THOUSAND)
TABLE 429 KUWAIT ICE-CREAM DRY MIXES MARKET, BY DISTRIBUTION CHANNEL, 2021-2030 (USD THOUSAND)
TABLE 430 KUWAIT B2C IN ICE-CREAM DRY MIXES MARKET, BY CATEGORY, 2021-2030 (USD THOUSAND)
TABLE 431 KUWAIT STORE-BASED RETAILING IN ICE-CREAM DRY MIXES MARKET, BY TYPE, 2021-2030 (USD THOUSAND)
TABLE 432 KUWAIT NON-STORE RETAILING IN ICE-CREAM DRY MIXES MARKET, BY TYPE, 2021-2030 (USD THOUSAND)
TABLE 433 EGYPT ICE-CREAM DRY MIXES MARKET, BY FLAVOR, 2021-2030 (THOUSAND)
TABLE 434 EGYPT ICE-CREAM DRY MIXES MARKET, BY FLAVOR, 2021-2030 (TONS)
TABLE 435 EGYPT ICE-CREAM DRY MIXES MARKET, BY FLAVOR, 2021-2030 (AVERAGE SELLING PRICE (USD PER KG))
TABLE 436 EGYPT ICE-CREAM DRY MIXES MARKET, BY CATEGORY, 2021-2030 (USD THOUSAND)
TABLE 437 EGYPT ICE-CREAM DRY MIXES MARKET, BY END USE, 2021-2030 (USD THOUSAND)
TABLE 438 EGYPT ICE-CREAM DRY MIXES MARKET, BY PACKAGING MATERIAL, 2021-2030 (USD THOUSAND)
TABLE 439 EGYPT ICE-CREAM DRY MIXES MARKET, BY PACKAGING TYPE, 2021-2030 (USD THOUSAND)
TABLE 440 EGYPT ICE-CREAM DRY MIXES MARKET, BY DISTRIBUTION CHANNEL, 2021-2030 (USD THOUSAND)
TABLE 441 EGYPT B2C IN ICE-CREAM DRY MIXES MARKET, BY CATEGORY, 2021-2030 (USD THOUSAND)
TABLE 442 EGYPT STORE-BASED RETAILING IN ICE-CREAM DRY MIXES MARKET, BY TYPE, 2021-2030 (USD THOUSAND)
TABLE 443 EGYPT NON-STORE RETAILING IN ICE-CREAM DRY MIXES MARKET, BY TYPE, 2021-2030 (USD THOUSAND)
TABLE 444 REST OF MIDDLE EAST AND AFRICA ICE-CREAM DRY MIXES MARKET, BY FLAVOR, 2021-2030 (THOUSAND)
TABLE 445 REST OF MIDDLE EAST AND AFRICA ICE-CREAM DRY MIXES MARKET, BY FLAVOR, 2021-2030 (TONS)
TABLE 446 REST OF MIDDLE EAST AND AFRICA ICE-CREAM DRY MIXES MARKET, BY FLAVOR, 2021-2030 (AVERAGE SELLING PRICE (USD PER KG))
List of Figure
FIGURE 1 GLOBAL ICE-CREAM DRY MIXES MARKET
FIGURE 2 GLOBAL ICE-CREAM DRY MIXES MARKET: DATA TRIANGULATION
FIGURE 3 GLOBAL ICE-CREAM DRY MIXES MARKET : DROC ANALYSIS
FIGURE 4 GLOBAL ICE-CREAM DRY MIXES MARKET: GLOBAL VS REGIONAL MARKET ANALYSIS
FIGURE 5 GLOBAL ICE-CREAM DRY MIXES MARKET: COMPANY RESEARCH ANALYSIS
FIGURE 6 GLOBAL ICE-CREAM DRY MIXES MARKET: MULTIVARIATE MODELLING
FIGURE 7 GLOBAL ICE-CREAM DRY MIXES MARKET: INTERVIEW DEMOGRAPHICS
FIGURE 8 GLOBAL ICE-CREAM DRY MIXES MARKET: DBMR MARKET POSITION GRID
FIGURE 9 GLOBAL ICE-CREAM DRY MIXES MARKET: MARKET END USE COVERAGE GRID
FIGURE 10 GLOBAL ICE-CREAM DRY MIXES MARKET : VENDOR SHARE ANALYSIS
FIGURE 11 GLOBAL ICE-CREAM DRY MIXES MARKET: SEGMENTATION
FIGURE 12 ASIA-PACIFIC IS EXPECTED TO DOMINATE THE GLOBAL ICE-CREAM DRY MIXES MARKET WITH THE HIGHEST CAGR IN THE FORECAST PERIOD
FIGURE 13 AVAILABILITY OF A WIDE SELECTION OF ICE CREAM FLAVOR POWDER MIXES, INCLUDING CHOCOLATE, VANILLA, AND OTHERS IS EXPECTED TO DRIVE THE GLOBAL ICE-CREAM DRY MIXES MARKET IN THE FORECAST PERIOD
FIGURE 14 THE VANILLA DRY ICE CREAM MIX IS EXPECTED TO ACCOUNT FOR THE LARGEST SHARE OF THE GLOBAL ICE-CREAM DRY MIXES MARKET IN 2023 AND 2030
FIGURE 15 ASIA PACIFIC IS THE FASTEST-GROWING MARKET FOR ICE-CREAM DRY MIXES MARKET MANUFACTURERS IN THE FORECAST PERIOD
FIGURE 16 THE ABOVE GRAPH REPRESENTS THE PRODUCTION AND CONSUMPTION RATIO FOR 2022-2026.
FIGURE 17 DRIVERS, RESTRAINTS, OPPORTUNITIES, AND CHALLENGES OF THE GLOBAL ICE-CREAM DRY MIXES MARKET
FIGURE 18 GLOBAL ICE-CREAM DRY MIXES MARKET: SNAPSHOT (2022)
FIGURE 19 ASIA-PACIFIC ICE-CREAM DRY MIXES MARKET: SNAPSHOT (2022)
FIGURE 20 EUROPE ICE-CREAM DRY MIXES MARKET: SNAPSHOT (2022)
FIGURE 21 NORTH AMERICA ICE-CREAM DRY MIXES MARKET: SNAPSHOT (2022)
FIGURE 22 SOUTH AMERICA ICE-CREAM DRY MIXES MARKET: SNAPSHOT (2022)
FIGURE 23 MIDDLE EAST AND AFRICA ICE-CREAM DRY MIXES MARKET: SNAPSHOT (2022)
FIGURE 24 GLOBAL ICE-CREAM DRY MIXES MARKET: COMPANY SHARE 2022 (%)
FIGURE 25 ASIA-PACIFIC ICE-CREAM DRY MIXES MARKET: COMPANY SHARE 2022 (%)
FIGURE 26 EUROPE ICE-CREAM DRY MIXES MARKET: COMPANY SHARE 2022 (%)
FIGURE 27 NORTH AMERICA ICE-CREAM DRY MIXES MARKET: COMPANY SHARE 2022 (%)
Global Ice Cream Dry Mixes Market, Supply Chain Analysis and Ecosystem Framework
To support market growth and help clients navigate the impact of geopolitical shifts, DBMR has integrated in-depth supply chain analysis into its Global Ice Cream Dry Mixes Market research reports. This addition empowers clients to respond effectively to global changes affecting their industries. The supply chain analysis section includes detailed insights such as Global Ice Cream Dry Mixes Market consumption and production by country, price trend analysis, the impact of tariffs and geopolitical developments, and import and export trends by country and HSN code. It also highlights major suppliers with data on production capacity and company profiles, as well as key importers and exporters. In addition to research, DBMR offers specialized supply chain consulting services backed by over a decade of experience, providing solutions like supplier discovery, supplier risk assessment, price trend analysis, impact evaluation of inflation and trade route changes, and comprehensive market trend analysis.
Data collection and base year analysis are done using data collection modules with large sample sizes. The stage includes obtaining market information or related data through various sources and strategies. It includes examining and planning all the data acquired from the past in advance. It likewise envelops the examination of information inconsistencies seen across different information sources. The market data is analysed and estimated using market statistical and coherent models. Also, market share analysis and key trend analysis are the major success factors in the market report. To know more, please request an analyst call or drop down your inquiry.
The key research methodology used by DBMR research team is data triangulation which involves data mining, analysis of the impact of data variables on the market and primary (industry expert) validation. Data models include Vendor Positioning Grid, Market Time Line Analysis, Market Overview and Guide, Company Positioning Grid, Patent Analysis, Pricing Analysis, Company Market Share Analysis, Standards of Measurement, Global versus Regional and Vendor Share Analysis. To know more about the research methodology, drop in an inquiry to speak to our industry experts.
Data Bridge Market Research is a leader in advanced formative research. We take pride in servicing our existing and new customers with data and analysis that match and suits their goal. The report can be customized to include price trend analysis of target brands understanding the market for additional countries (ask for the list of countries), clinical trial results data, literature review, refurbished market and product base analysis. Market analysis of target competitors can be analyzed from technology-based analysis to market portfolio strategies. We can add as many competitors that you require data about in the format and data style you are looking for. Our team of analysts can also provide you data in crude raw excel files pivot tables (Fact book) or can assist you in creating presentations from the data sets available in the report.


