
Global Spirometer Market
Market Size in USD Million
 USD
875.04 Million
USD
2,002.07 Million
2024
2032
USD
875.04 Million
USD
2,002.07 Million
2024
2032
| 2025 - 2032 | |
| USD 875.04 Million | |
| USD 2,002.07 Million | |
| % | |
|
Spirometer Market Size
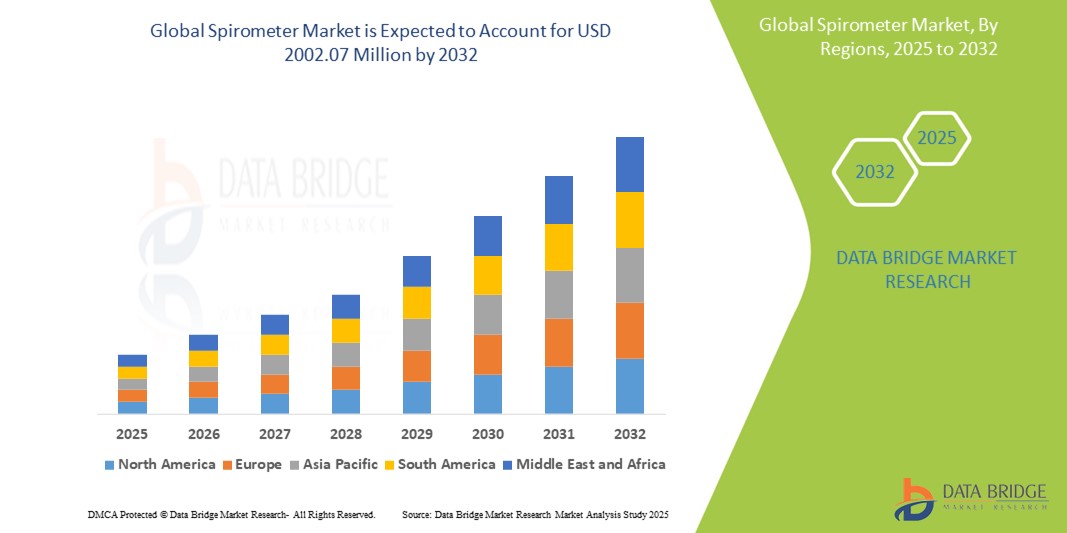
- The global spirometer market size was valued at USD 875.04 million in 2024 and is expected to reach USD 2002.07 million by 2032, at a CAGR of 10.90% during the forecast period
- This growth is driven by factors such as rising prevalence of respiratory diseases, an aging population, and advancements in technology
Spirometer Market Analysis
- Spirometers are essential diagnostic devices used to assess lung function by measuring the volume and flow of air during inhalation and exhalation. They play a crucial role in diagnosing and monitoring respiratory conditions, including COPD, asthma, and lung cancer, supporting better disease management and treatment planning
- The spirometer market is experiencing significant growth, driven by the increasing prevalence of respiratory diseases, advancements in spirometer technology, and the rising demand for early diagnosis. In addition, the growing focus on healthcare infrastructure and the shift toward homecare monitoring are further contributing to the market's expansion
- North America is expected to dominate the spirometer market with a share of 42.1%, due to the high prevalence of chronic respiratory diseases, particularly chronic obstructive pulmonary disease (COPD), asthma, and lung cancer
- Asia-Pacific is expected to be the fastest growing region in the spirometer market during the forecast period due to expanding healthcare investments, rapid urbanization, and an increasing aging population, which contributes to the rising burden of respiratory diseases
- Flow measurement spirometer segment is expected to dominate the market with a market share of 67.2% due to its widespread application in diagnosing and monitoring respiratory conditions, such as asthma and chronic obstructive pulmonary disease (COPD). These devices are favored for their accuracy in measuring airflow, essential for assessing lung function, and are commonly used in both clinical and home settings
Report Scope and Spirometer Market Segmentation
|
Attributes |
Spirometer Key Market Insights |
|
Segments Covered |
|
|
Countries Covered |
North America
Europe
Asia-Pacific
Middle East and Africa
South America
|
|
Key Market Players |
|
|
Market Opportunities |
|
|
Value Added Data Infosets |
In addition to the insights on market scenarios such as market value, growth rate, segmentation, geographical coverage, and major players, the market reports curated by the Data Bridge Market Research also include depth expert analysis, patient epidemiology, pipeline analysis, pricing analysis, and regulatory framework. |
Spirometer Market Trends
“Increasing Prevalence of Chronic Respiratory Diseases”
- One prominent trend in the global spirometer market is the increasing prevalence of chronic respiratory diseases
- This trend is driven by the rising number of individuals affected by these conditions, leading to a greater demand for early diagnosis, effective monitoring, and improved disease management
- For instance, companies such as Philips and ResMed are developing advanced spirometry solutions with enhanced accuracy and portability, enabling better lung function assessment both in clinics and at home
- The growing focus on remote monitoring and homecare solutions is also contributing to innovations in spirometer technology, providing real-time data for improved patient care
- As healthcare providers emphasize early intervention and personalized treatment, the increasing prevalence of chronic respiratory diseases is expected to significantly drive the market for spirometers
Spirometer Market Dynamics
Driver
“Integration with Electronic Health Records (EHRs)”
- Integration with Electronic Health Records (EHRs) is a significant driver for growth in the spirometer market, as it enables seamless sharing of lung function data between healthcare providers for more comprehensive patient management
- This trend is particularly prominent in healthcare sectors focused on respiratory care, where accurate monitoring and continuous tracking of lung health are essential for managing chronic diseases such as chronic obstructive pulmonary disease and asthma
- With the increasing adoption of EHR systems worldwide, there is a rising demand for spirometers that can easily integrate with these platforms, ensuring real-time access to patient data and improving care coordination
- Manufacturers are advancing spirometer technology to offer enhanced connectivity features, such as wireless data transfer and cloud-based storage, which facilitate automatic uploading of patient results to EHRs
- The push for improved patient outcomes through better data accessibility and treatment personalization is intensifying the demand for spirometers with EHR integration across hospitals and clinics
For instance,
- Welch Allyn offers spirometers with EHR connectivity, enabling quick data exchange for faster diagnosis and better patient management in clinics
- MIR (Medical International Research) has introduced spirometers with built-in EHR synchronization, providing healthcare providers with a comprehensive view of patient health trends
- The spirometer market is expected to see robust growth, fueled by the integration of EHRs, continuous innovations in spirometry technology, and the global emphasis on better healthcare data management
Opportunity
“Rising Demand for Telemedicine and Remote Monitoring”
- The rising demand for telemedicine and remote monitoring presents a significant opportunity for the spirometer market, driven by the increasing need for convenient and accessible healthcare solutions, especially for managing chronic respiratory diseases
- Healthcare sectors are focusing on advanced spirometry solutions that allow for remote monitoring of lung function, enabling patients to manage conditions such as COPD and asthma from home, which creates a demand for innovative spirometers equipped with wireless connectivity and real-time data sharing
- This opportunity aligns with the broader trend toward patient-centered care, where remote monitoring tools help personalize treatment plans, improving patient outcomes and reducing the burden on healthcare facilities
For instance,
- MIR (Medical International Research) has introduced spirometers with cloud-based storage and mobile app integration, allowing for easy access and sharing of patient data for remote consultations
- CareFusion, a BD company, has developed spirometers with telemedicine capabilities, enabling remote disease management and reducing hospital visits for chronic respiratory patients
- As the demand for telemedicine and remote patient monitoring grows globally, the spirometer market is set to experience significant expansion and innovation, providing patients and healthcare providers with more efficient and accessible solutions
Restraint/Challenge
“Risk of Infection Transmission”
- The risk of infection transmission presents a significant challenge for the spirometer market, particularly with the growing demand for devices used in both clinical and homecare settings
- Concerns about cross-contamination and the spread of infections through reusable spirometer components, such as mouthpieces and tubing, have raised the need for stringent hygiene protocols. This increases the overall cost of device maintenance and limits accessibility for healthcare providers seeking cost-effective solutions
- This challenge is especially prominent in regions with strict infection control regulations, where manufacturers must ensure that their products meet rigorous hygiene and sterilization standards to prevent the transmission of airborne diseases
For instance,
- Fujifilm has developed disposable mouthpieces and filters for its spirometer models to reduce the risk of infection transmission in clinical settings
- The need for effective infection control and the costs associated with maintaining high hygiene standards may hinder the pace of innovation and increase market entry barriers, especially for smaller manufacturers
Spirometer Market Scope
The market is segmented on the basis of product type, technology, mechanism, disease, disposable components, application, end-user, and distribution channel.
|
Segmentation |
Sub-Segmentation |
|
By Product Type |
|
|
By Technology |
|
|
By Mechanism |
|
|
By Disease
|
|
|
By Disposable Components |
|
|
By Application |
|
|
BY End-User |
|
|
By Distribution Channel |
|
In 2025, the flow measurement spirometer is projected to dominate the market with a largest share in technology segment
The flow measurement spirometer segment is expected to dominate the spirometer market with the largest share of 67.2% in 2025 due to its widespread application in diagnosing and monitoring respiratory conditions, such as asthma and chronic obstructive pulmonary disease (COPD). These devices are favored for their accuracy in measuring airflow, essential for assessing lung function, and are commonly used in both clinical and home settings.
The COPD is expected to account for the largest share during the forecast period in application market
In 2025, the COPD segment is expected to dominate the market with the largest market share of 40.5% due to increasing prevalence of COPD globally, driven by factors such as aging populations, smoking rates, and environmental pollution. COPD requires regular monitoring and management, making spirometers essential for diagnosing, tracking disease progression, and assessing treatment efficacy.
Spirometer Market Regional Analysis
“North America Holds the Largest Share in the Spirometer Market”
- North America dominates the spirometer market with a share of 42.1%, driven by the high prevalence of chronic respiratory diseases, particularly chronic obstructive pulmonary disease (COPD), asthma, and lung cancer
- U.S. holds a significant share due to its advanced healthcare infrastructure, extensive healthcare network, and strong medical device industry
- The region's well-established healthcare system, supported by substantial investments in respiratory care technologies and research, positions it as a leader in the market. In addition, the growing use of homecare and telemedicine services is further driving the demand for portable and connected spirometers
- As the need for early detection, disease management, and personalized care increases, North America is expected to maintain its dominant position through 2032, bolstered by continuous advancements in spirometry technologies and favorable healthcare policies
“Asia-Pacific is Projected to Register the Highest CAGR in the Spirometer Market”
- Asia-Pacific is expected to witness the highest growth rate in the spirometer market, driven by expanding healthcare investments, rapid urbanization, and an increasing aging population, which contributes to the rising burden of respiratory diseases
- India holds a significant share due to improving healthcare infrastructure, rising awareness about early diagnosis, and increasing investments in respiratory care
- As chronic respiratory conditions, such as asthma and COPD, become more prevalent in the region, the demand for spirometers in both clinical and homecare settings is expected to rise. In addition, the increased focus on telemedicine and remote monitoring further accelerates the adoption of spirometry technologies in Asia-Pacific
- Local manufacturers are also playing a vital role by offering cost-effective spirometry solutions, catering to the growing demand in developing countries. With continued healthcare investments, infrastructure expansion, and technological advancements, Asia-Pacific is set to become the fastest-growing region in the spirometer market through 2032
Spirometer Market Share
The market competitive landscape provides details by competitor. Details included are company overview, company financials, revenue generated, market potential, investment in research and development, new market initiatives, global presence, production sites and facilities, production capacities, company strengths and weaknesses, product launch, product width and breadth, application dominance. The above data points provided are only related to the companies' focus related to market.
The Major Market Leaders Operating in the Market Are:
- F. Hoffmann-La Roche, Ltd. (Switzerland)
- Viatris Inc. (U.S.)
- Sanofi (France)
- Pfizer Inc. (U.S.)
- GSK plc. (U.K.)
- Novartis AG (Switzerland)
- Bayer AG (Germany)
- Merck & Co., Inc. (U.S.)
- AstraZeneca (U.K.)
- Cipla (U.S.)
- Merck KGaA (Germany)
- LEO Pharma A/S (Denmark)
- Sun Pharmaceutical Industries Ltd. (India)
- Aurobindo Pharma (India)
- Lupin (India)
- Fresenius Kabi AG (Germany)
- Amneal Pharmaceuticals LLC. (U.S.)
Latest Developments in Global Spirometer Market
- In September 2022, RxCap, Inc. partnered with ZEPHYRx to integrate ZEPHYRx's online spirometry platform with RxCap's remote surveillance system. This collaboration enables RxCap's corporate clients, including healthcare providers and insurers, to monitor the lung health of patients with severe respiratory diseases remotely
- In August 2022, AstraZeneca collaborated with Alveofit to deploy IoT-enabled portable spirometers in U.S. clinics. These handheld devices connect to the internet, enabling online patient tracking and tele-spirometry. Integrated with comprehensive care management systems, they enhance respiratory care accessibility and efficiency
- In November 2021, Cipla launched Spirofy, India's first pneumotach-based portable, wireless spirometer, on World Chronic Obstructive Pulmonary Disease (COPD) Day. This launch is set to significantly impact the spirometer market in India, aiming to transform the diagnosis of Obstructive Airway Disease (OAD) and reinforcing Cipla's ambition to solidify its leadership in the country's respiratory care sector. The introduction of this innovative device is expected to increase the accessibility and efficiency of OAD diagnosis, further driving demand for advanced spirometry solutions in the region
- In April 2021, Vitalograph launched the next-generation Pneumotrac spirometer in the U.S. This device, paired with Spirotrac PC software, is designed for precise respiratory diagnosis in both adult and pediatric patients, enhancing diagnostic capabilities and clinical management in respiratory healthcare
SKU-

- Interactive Data Analysis Dashboard
- Company Analysis Dashboard for high growth potential opportunities
- Research Analyst Access for customization & queries
- Competitor Analysis with Interactive dashboard
- Latest News, Updates & Trend analysis
- Harness the Power of Benchmark Analysis for Comprehensive Competitor Tracking
Data collection and base year analysis are done using data collection modules with large sample sizes. The stage includes obtaining market information or related data through various sources and strategies. It includes examining and planning all the data acquired from the past in advance. It likewise envelops the examination of information inconsistencies seen across different information sources. The market data is analysed and estimated using market statistical and coherent models. Also, market share analysis and key trend analysis are the major success factors in the market report. To know more, please request an analyst call or drop down your inquiry.
The key research methodology used by DBMR research team is data triangulation which involves data mining, analysis of the impact of data variables on the market and primary (industry expert) validation. Data models include Vendor Positioning Grid, Market Time Line Analysis, Market Overview and Guide, Company Positioning Grid, Patent Analysis, Pricing Analysis, Company Market Share Analysis, Standards of Measurement, Global versus Regional and Vendor Share Analysis. To know more about the research methodology, drop in an inquiry to speak to our industry experts.
Data Bridge Market Research is a leader in advanced formative research. We take pride in servicing our existing and new customers with data and analysis that match and suits their goal. The report can be customized to include price trend analysis of target brands understanding the market for additional countries (ask for the list of countries), clinical trial results data, literature review, refurbished market and product base analysis. Market analysis of target competitors can be analyzed from technology-based analysis to market portfolio strategies. We can add as many competitors that you require data about in the format and data style you are looking for. Our team of analysts can also provide you data in crude raw excel files pivot tables (Fact book) or can assist you in creating presentations from the data sets available in the report.


