
Global Wet Milling Market
Market Size in USD Million
 USD
781.57 Million
USD
861.87 Million
2024
2032
USD
781.57 Million
USD
861.87 Million
2024
2032
| 2025 - 2032 | |
| USD 781.57 Million | |
| USD 861.87 Million | |
| % | |
|
Wet-Milling Market Analysis
The wet-milling market involves processing grains such as corn, wheat, and cassava to produce products such as starch, sweeteners, ethanol, gluten meal, and corn oil. This process separates grain components using water and specialized equipment such as steeping systems, centrifuges, and filtration units. The market is driven by the rising demand for bioethanol, increasing applications in food and beverage industries, and the growing use of starch in bioplastics and adhesives. Key players, including ADM, Cargill, Roquette Frères, and Tate & Lyle, are investing in advanced processing technologies and expanding production capacities. Recent developments include collaborations for sustainable starch production and innovations in enzymatic wet-milling to improve efficiency. In addition, increasing consumer preference for plant-based products is shaping market dynamics. With significant demand from feed, food, and industrial applications, the market is poised for growth, supported by advancements in milling equipment and a focus on environmentally friendly processing solutions.
Wet-Milling Market Size
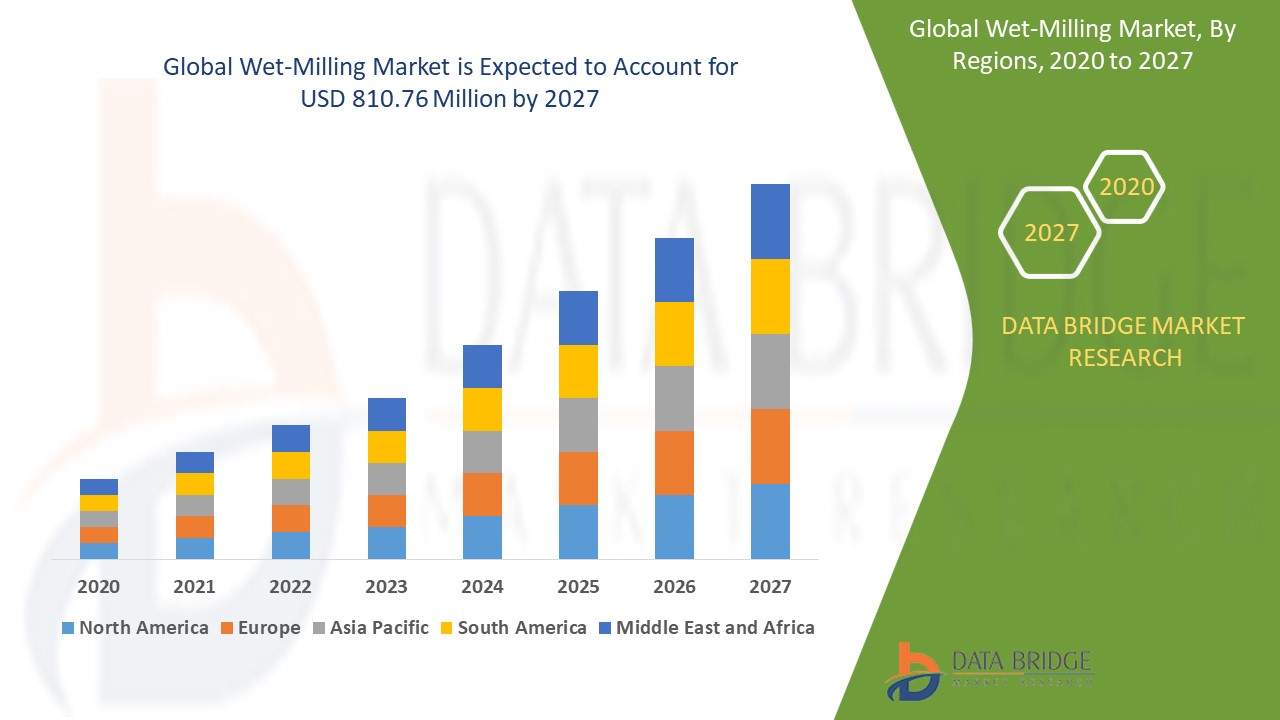
The global wet-milling market size was valued at USD 781.57 million in 2024 and is projected to reach USD 861.87 million by 2032, with a CAGR of 1.23% during the forecast period of 2025 to 2032. In addition to the insights on market scenarios such as market value, growth rate, segmentation, geographical coverage, and major players, the market reports curated by the Data Bridge Market Research also include in-depth expert analysis, pricing analysis, brand share analysis, consumer survey, demography analysis, supply chain analysis, value chain analysis, raw material/consumables overview, vendor selection criteria, PESTLE Analysis, Porter Analysis, and regulatory framework.
Wet-Milling Market Trends
“Demand of Plant-Based Product”
The increasing shift toward plant-based diets is a significant driver of demand for wet-milled products such as starch, sweeteners, and gluten. As consumers prioritize health, sustainability, and ethical food choices, plant-derived ingredients are gaining traction in various sectors, including food, beverages, and dietary supplements. Wet-milled starches are widely used as thickeners, stabilizers, and texturizers in plant-based dairy and meat alternatives. Similarly, sweeteners derived from wet milling cater to the rising demand for natural and reduced-sugar products. Gluten and other proteins extracted through wet milling are essential in creating high-protein, plant-based food formulations. This trend underscores the growing reliance on wet-milling processes to meet the expanding needs of the plant-based food and beverage industry globally.
Report Scope and Wet-Milling Market Segmentation
|
Attributes |
Wet-Milling Key Market Insights |
|
Segments Covered |
|
|
Countries Covered |
U.S., Canada and Mexico in North America, Germany, France, U.K., Netherlands, Switzerland, Belgium, Russia, Italy, Spain, Turkey, Rest of Europe in Europe, China, Japan, India, South Korea, Singapore, Malaysia, Australia, Thailand, Indonesia, Philippines, Rest of Asia-Pacific (APAC) in the Asia-Pacific (APAC), Saudi Arabia, U.A.E., South Africa, Egypt, Israel, Rest of Middle East and Africa (MEA) as a part of Middle East and Africa (MEA), Brazil, Argentina and Rest of South America as part of South America |
|
Key Market Players |
Tate & Lyle (U.K.), Cargill, Incorporated. (U.S.), ADM (U.S.), Dacheng Biochemical Technology Group Co., Ltd (China), Grain Processing Corporation (U.S.), Roquette Frères (France), AGRANA Beteiligungs-AG (Austria), Ingredion (U.S.), GEA Group Aktiengesellschaft (Germany), ALFA LAVAL (Sweden), Bühler AG (Switzerland), ANDRITZ (Austria), Ingetecsa (Spain), Thai German Processing Co., Ltd. (Thailand), Yonghan Machinery Co., Ltd. (China), NETZSCH-Feinmahltechnik GmbH (Germany), Hanningfield (U.K.), Willy A. Bachofen AG (Switzerland) |
|
Market Opportunities |
|
|
Value Added Data Infosets |
In addition to the insights on market scenarios such as market value, growth rate, segmentation, geographical coverage, and major players, the market reports curated by the Data Bridge Market Research also include in-depth expert analysis, geographically represented company-wise production and capacity, network layouts of distributors and partners, detailed and updated price trend analysis and deficit analysis of supply chain and demand. |
Wet-Milling Market Definition
Wet milling is a process used to separate and refine components of grains, such as corn, wheat, and cassava, through the use of water and specialized equipment. The method involves steeping the grains to soften them, followed by grinding and separating them into their core components, including starch, protein, fiber, and germ. This technique enables the production of a wide range of products such as sweeteners, ethanol, corn oil, gluten meal, and starch derivatives. Wet milling is widely employed in industries such as food and beverages, biofuels, and bioplastics, due to its ability to produce high-purity and versatile ingredients that cater to diverse applications.
Wet-Milling Market Dynamics
Drivers
- Rising Demand for Processed Food and Beverages
The increased consumption of processed foods and beverages plays a significant role in driving the growth of the wet-milling market. As the demand for convenience foods rises globally, wet-milling techniques are essential for producing key ingredients such as starches, flours, and sugars, which are integral to various processed food products. Wet-milling allows for the efficient extraction and refinement of these ingredients, ensuring consistent quality and functionality in food manufacturing. With changing consumer lifestyles and preferences for ready-to-eat, packaged food, the wet-milling market is poised for expansion, meeting the growing need for high-quality raw materials in the food and beverage sector.
- Growing Food Industry
Wet-milling plays a crucial role in producing gluten-free products, alternative proteins, and other specialty food ingredients, which are increasingly in demand among health-conscious consumers. As the global prevalence of gluten sensitivity and celiac disease rises, the need for gluten-free alternatives has surged, driving the wet-milling market. In addition, the growing trend of plant-based diets and the demand for sustainable, alternative proteins have made wet-milling essential in the production of plant-based protein isolates. By enabling the extraction of vital ingredients from grains, legumes, and other plant sources, wet-milling supports the creation of innovative food products, driving market growth in specialty food segments.
Opportunities
- Rising Consumer Preferences for Natural Ingredients
The growing consumer preference for natural and organic products has created a significant opportunity for the wet-milling market. As consumers become more health-conscious and environmentally aware, the demand for plant-based, organic ingredients in food, cosmetics, and pharmaceuticals has surged. Wet-milling is a key technique for extracting natural components such as starches, proteins, and fibers from organic plant sources such as grains, legumes, and vegetables. This process supports the production of clean-label products that meet consumer expectations for purity and sustainability. As the shift towards organic and natural products continues, the wet-milling market is well-positioned to capitalize on this trend, fostering growth and innovation.
- Sustainability and Environmental Considerations
Wet-milling processes that emphasize sustainability, such as water conservation and energy-efficient production methods, present a significant market opportunity. As environmental concerns grow globally, industries are increasingly adopting eco-friendly practices to reduce their carbon footprint and resource consumption. Wet-milling, which traditionally requires substantial water and energy, is evolving with new technologies that optimize resource use, reduce waste, and enhance overall sustainability. This shift aligns with the growing demand for environmentally responsible production methods across various sectors, including food, biofuels, and pharmaceuticals. Companies that integrate sustainable wet-milling practices can attract environmentally conscious consumers and meet stricter regulatory standards, driving market growth.
Restraints/Challenges
- High Energy Consumption
Wet-milling processes are inherently energy-intensive, requiring substantial amounts of electricity and heat to refine raw materials. This high energy consumption leads to increased production costs, making it a significant challenge for manufacturers seeking to maintain profitability. As energy prices fluctuate, companies face greater pressure to optimize their operations while keeping costs in check. The need for continuous innovation in energy-efficient technologies is critical to improving the sustainability of wet-milling processes. However, developing and implementing these innovations remains challenging due to high upfront investments and the complexity of retrofitting existing systems. As a result, energy efficiency continues to be a key hurdle in the market.
- Raw Material Price Fluctuations
The prices of raw materials such as corn, wheat, and other grains are subject to significant volatility due to factors such as climate conditions, agricultural policies, and global supply chain disruptions. This price instability can directly impact the wet-milling industry, as fluctuating raw material costs lead to unpredictable production expenses. Manufacturers may struggle to manage margins, particularly when raw material prices rise unexpectedly. In some cases, the volatility can also result in reduced profit margins or the need for price adjustments, which can affect market stability. This unpredictability in raw material costs serves as a major restraint, hindering long-term strategic planning and investment in the sector.
This market report provides details of new recent developments, trade regulations, import-export analysis, production analysis, value chain optimization, market share, impact of domestic and localized market players, analyses opportunities in terms of emerging revenue pockets, changes in market regulations, strategic market growth analysis, market size, category market growths, application niches and dominance, product approvals, product launches, geographic expansions, technological innovations in the market. To gain more info on the market contact Data Bridge Market Research for an Analyst Brief, our team will help you take an informed market decision to achieve market growth.
Impact and Current Market Scenario of Raw Material Shortage and Shipping Delays
Data Bridge Market Research offers a high-level analysis of the market and delivers information by keeping in account the impact and current market environment of raw material shortage and shipping delays. This translates into assessing strategic possibilities, creating effective action plans, and assisting businesses in making important decisions.
Apart from the standard report, we also offer in-depth analysis of the procurement level from forecasted shipping delays, distributor mapping by region, commodity analysis, production analysis, price mapping trends, sourcing, category performance analysis, supply chain risk management solutions, advanced benchmarking, and other services for procurement and strategic support.
Expected Impact of Economic Slowdown on the Pricing and Availability of Products
When economic activity slows, industries begin to suffer. The forecasted effects of the economic downturn on the pricing and accessibility of the products are taken into account in the market insight reports and intelligence services provided by DBMR. With this, our clients can typically keep one step ahead of their competitors, project their sales and revenue, and estimate their profit and loss expenditures.
Wet-Milling Market Scope
The market is segmented on the basis of equipment, processing size, source, end product, and application. The growth amongst these segments will help you analyse meagre growth segments in the industries and provide the users with a valuable market overview and market insights to help them make strategic decisions for identifying core market applications.
Equipment
- Milling equipment
- Steeping equipment
- Centrifuge system
- Washing and filtration system
Processing Size
- Medium line processing
- Large line processing
Source
- Corn
- Wheat
- Cassava
- Potato
End Product
- Sweetener
- Ethanol
- Corn gluten meal and gluten feed
- Corn oil
- Corn steep liquor
- Protein
Application
- Feed
- Food
- Steep water
- Oil processing
- Fermentation/bioprocessing
- Waste treatment
- Mill
- Refinery
- Ethanol production
- Starch modification
Wet-Milling Market Regional Analysis
The market is analysed and market size insights and trends are provided by country, equipment, processing size, source, end product, and application as referenced above.
The countries covered in the market report are U.S., Canada and Mexico in North America, Germany, France, U.K., Netherlands, Switzerland, Belgium, Russia, Italy, Spain, Turkey, Rest of Europe in Europe, China, Japan, India, South Korea, Singapore, Malaysia, Australia, Thailand, Indonesia, Philippines, Rest of Asia-Pacific (APAC) in the Asia-Pacific (APAC), Saudi Arabia, U.A.E., South Africa, Egypt, Israel, Rest of Middle East and Africa (MEA) as a part of Middle East and Africa (MEA), Brazil, Argentina and Rest of South America as part of South America.
North America dominates the global wet milling market, with the U.S. at the forefront due to the growing demand for wet-milled products such as starch. Europe follows closely, where Germany holds a dominant position driven by the rising need for fruit sugars. This regional growth reflects an increasing preference for wet-milled ingredients across various industries, including food and beverage.
Asia Pacific region is expected to be the fastest-growing market for wet-milling services, fueled by the rising demand for corn-based products. Other key regions with robust corn production and processing industries are also contributing to this growth. These areas are experiencing increasing demand for corn wet-milling services across various sectors, including food, biofuels, and pharmaceuticals, driving rapid market expansion.
The country section of the report also provides individual market impacting factors and changes in regulation in the market domestically that impacts the current and future trends of the market. Data points such as down-stream and upstream value chain analysis, technical trends and porter's five forces analysis, case studies are some of the pointers used to forecast the market scenario for individual countries. Also, the presence and availability of global brands and their challenges faced due to large or scarce competition from local and domestic brands, impact of domestic tariffs and trade routes are considered while providing forecast analysis of the country data.
Wet-Milling Market Share
The market competitive landscape provides details by competitor. Details included are company overview, company financials, revenue generated, market potential, investment in research and development, new market initiatives, global presence, production sites and facilities, production capacities, company strengths and weaknesses, product launch, product width and breadth, application dominance. The above data points provided are only related to the companies' focus related to market.
Wet-Milling Market Leaders Operating in the Market Are:
- Tate & Lyle (U.K.)
- Cargill, Incorporated. (U.S.)
- ADM (U.S.)
- Dacheng Biochemical Technology Group Co., Ltd (China)
- Grain Processing Corporation (U.S.)
- Roquette Frères (France)
- AGRANA Beteiligungs-AG (Austria)
- Ingredion (U.S.)
- GEA Group Aktiengesellschaft (Germany)
- ALFA LAVAL (Sweden)
- Bühler AG (Switzerland)
- ANDRITZ (Austria)
- Ingetecsa (Spain)
- Thai German Processing Co., Ltd. (Thailand)
- Yonghan Machinery Co.,Ltd. (China)
- NETZSCH-Feinmahltechnik GmbH (Germany)
- Hanningfield (U.K.)
- Willy A. Bachofen AG (Switzerland)
Latest Developments in Wet-Milling Market
- In January 2022, Ambuja Exports, a prominent construction company based in India, saw a 4.96% rise in its share price following the announcement of plans to build a new corn wet-milling plant in Gujarat. This move is expected to strengthen the company’s position in the growing wet milling market. The investment in the new facility reflects the company’s commitment to capitalizing on the increasing demand for corn-based products
- In September 2022, Cargill inaugurated a new corn wet mill plant in Indonesia with an investment of USD 100 million. This facility is strategically positioned to support the growing demand in the Asian market for products such as sweeteners, starch, and animal feed. The expansion enhances Cargill’s production capabilities, strengthening its presence in the region and addressing the rising consumption of corn-based products
SKU-

- Interactive Data Analysis Dashboard
- Company Analysis Dashboard for high growth potential opportunities
- Research Analyst Access for customization & queries
- Competitor Analysis with Interactive dashboard
- Latest News, Updates & Trend analysis
- Harness the Power of Benchmark Analysis for Comprehensive Competitor Tracking
Global Wet Milling Market, Supply Chain Analysis and Ecosystem Framework
To support market growth and help clients navigate the impact of geopolitical shifts, DBMR has integrated in-depth supply chain analysis into its Global Wet Milling Market research reports. This addition empowers clients to respond effectively to global changes affecting their industries. The supply chain analysis section includes detailed insights such as Global Wet Milling Market consumption and production by country, price trend analysis, the impact of tariffs and geopolitical developments, and import and export trends by country and HSN code. It also highlights major suppliers with data on production capacity and company profiles, as well as key importers and exporters. In addition to research, DBMR offers specialized supply chain consulting services backed by over a decade of experience, providing solutions like supplier discovery, supplier risk assessment, price trend analysis, impact evaluation of inflation and trade route changes, and comprehensive market trend analysis.
Data collection and base year analysis are done using data collection modules with large sample sizes. The stage includes obtaining market information or related data through various sources and strategies. It includes examining and planning all the data acquired from the past in advance. It likewise envelops the examination of information inconsistencies seen across different information sources. The market data is analysed and estimated using market statistical and coherent models. Also, market share analysis and key trend analysis are the major success factors in the market report. To know more, please request an analyst call or drop down your inquiry.
The key research methodology used by DBMR research team is data triangulation which involves data mining, analysis of the impact of data variables on the market and primary (industry expert) validation. Data models include Vendor Positioning Grid, Market Time Line Analysis, Market Overview and Guide, Company Positioning Grid, Patent Analysis, Pricing Analysis, Company Market Share Analysis, Standards of Measurement, Global versus Regional and Vendor Share Analysis. To know more about the research methodology, drop in an inquiry to speak to our industry experts.
Data Bridge Market Research is a leader in advanced formative research. We take pride in servicing our existing and new customers with data and analysis that match and suits their goal. The report can be customized to include price trend analysis of target brands understanding the market for additional countries (ask for the list of countries), clinical trial results data, literature review, refurbished market and product base analysis. Market analysis of target competitors can be analyzed from technology-based analysis to market portfolio strategies. We can add as many competitors that you require data about in the format and data style you are looking for. Our team of analysts can also provide you data in crude raw excel files pivot tables (Fact book) or can assist you in creating presentations from the data sets available in the report.


