
Market Analysis and Insights: Middle East and Africa Decor Paper Market
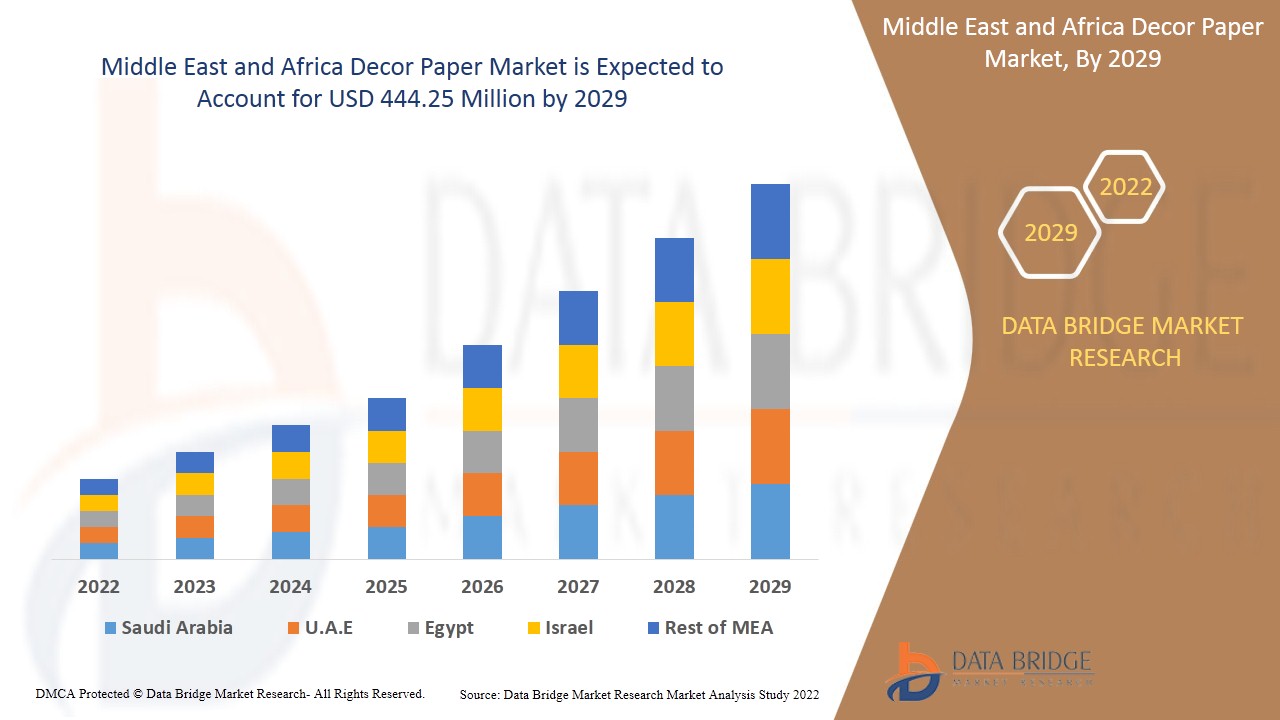
Middle East & Africa decor paper market is expected to gain significant growth in the forecast period of 2022 to 2029. Data Bridge Market Research analyzes that the market is growing with a CAGR of 4.9% in the forecast period of 2022 to 2029 and is expected to reach USD 444.25 million by 2029. Extensive usage of smartphones and other digital devices with internet facilities is boosting the market growth.
Decor paper is used in getting quality finishes on wooden materials after impregnating. They are available in a variety of colors and weights. Recently, the machine-smoothed décor paper has gathered some steam among consumers. Flooring, paneling, and furniture surfaces are just a few of the primary application areas for the décor paper. The need for light-resistant, chemically inert décor paper has increased significantly with the rising demand for home décor. Furthermore, changing certification and standards criteria for products in wood-working markets vary from country to country. This has made a large bearing on the growth trajectories in the decor paper market.
Accelerating urbanization and consumer preferences toward modern product designs in home décor acts as a driver in the growth of the Middle East & Africa decor paper market. Shortage of raw materials for decor paper production prove to be a challenge. However, fundamental shift of demand for home décor amid the pandemic is expected to provide opportunities for the Middle East & Africa decor paper market. Stringent government norms & regulations regarding deforestation can prove to be a restrain for the market growth.
The Middle East & Africa decor paper market report provides details of market share, new developments, and product pipeline analysis, impact of domestic and localized market players, analyses opportunities in terms of emerging revenue pockets, changes in market regulations, product approvals, strategic decisions, product launches, geographic expansions, and technological innovations in the market. To understand the analysis and the Decor Paper market scenario contact Data Bridge Market Research for an Analyst Brief, our team will help you create a revenue impact solution to achieve your desired goal.
The Decor Paper market report provides details of market share, new developments, and product pipeline analysis, impact of domestic and localized market players, analyses opportunities in terms of emerging revenue pockets, changes in market regulations, product approvals, strategic decisions, product launches, geographic expansions, and technological innovations in the market. To understand the analysis and the decor paper market scenario contact Data Bridge Market Research for an Analyst Brief, our team will help you create a revenue impact solution to achieve your desired goal.
Decor Paper Market Scope and Market Size
Middle East & Africa decor paper market is segmented into seven notable segments which are product type, weight, color, application, raw materials, end-use and industry. The growth among segments helps you analyze niche pockets of growth and strategies to approach the market and determine your core application areas and the difference in your target markets.
- On the basis of product type, the Middle East & Africa decor paper market is segmented into absorbent Kraft paper, print base paper, UNI paper, base paper for foil production, edge banding paper & others. In 2022, the print base paper is expected to dominate the market because it is highly loaded with white and color pigments that provide high opacity, and also possesses good absorbency and better-wet strength.
- On the basis of weight, the Middle East & Africa decor paper market is segmented into less than 65 GSM, 65-80 GSM, 81- 100 GSM, and above 100 GSM. In 2022, less than 65 GSM is expected to dominate the market as they are economical and lightweight which is perfect for fast printing.
- On the basis of color, the Middle East & Africa decor paper market is segmented into white, cream, beige, brown, grey, and black. In 2022, brown color is expected to dominate the market as it gives good surface finishing and more of a natural look in the home décor.
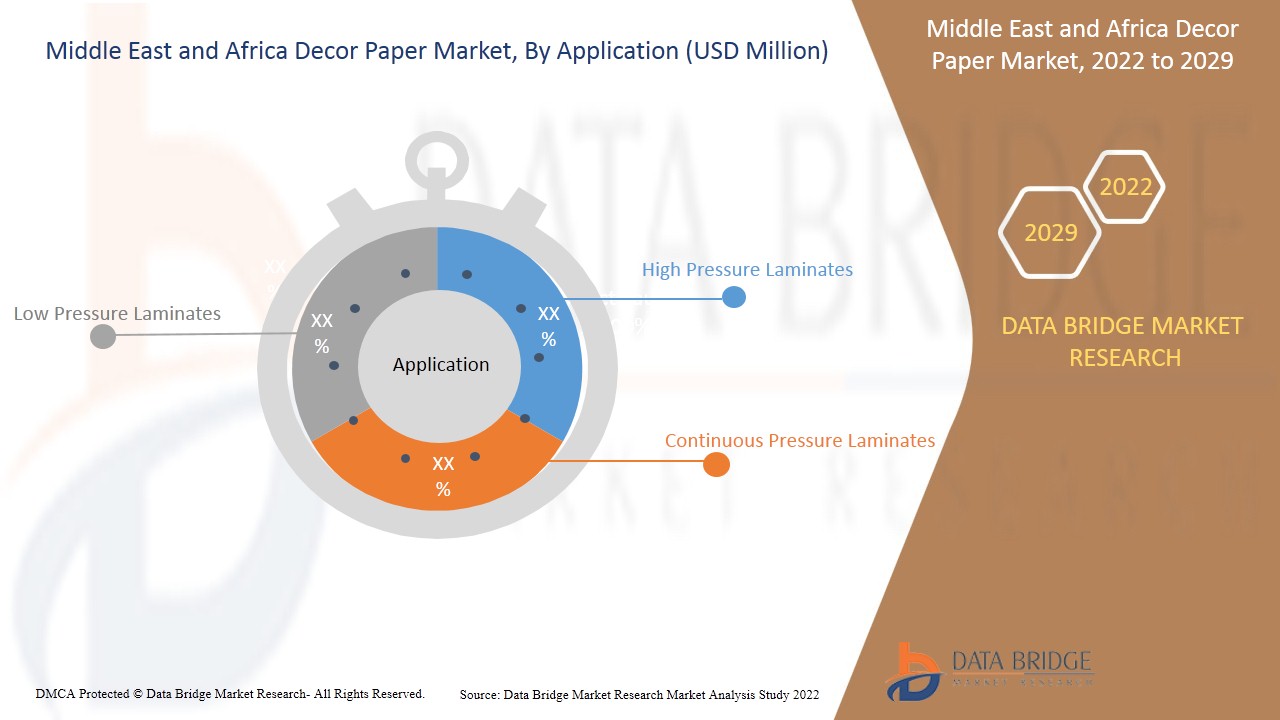
- On the basis of application, the Middle East & Africa decor paper market is segmented into low-pressure laminates, high-pressure laminates, and continuous pressure laminates. In 2022, high-pressure laminates are expected to dominate the market as they are commonly used in residential and commercial areas.
- On the basis of raw materials, the Middle East & Africa decor paper market is segmented into fillers & binders, pulp, coatings, additives, and others. In 2022, pulp is expected to dominate the market as the décor paper is mostly manufactured from pulp and is the most sustainable raw material for product design.
- On the basis of end-use, the Middle East & Africa decor paper market is segmented into furniture, and cabinets, flooring, paneling, store fixture, wallpaper, wallcovering laminates & direct printing. In 2022, flooring is expected to dominate the market as they are used to upgrading the surface of a wood-based panel in commercial and residential areas.
- On the basis of industry, the Middle East & Africa decor paper market is segmented into household type & commercial type. In 2022, the commercial type is expected to dominate the market as décor papers are highly used in commercial spaces to decorate the interior walls.
Decor Paper Market Country Level Analysis
The Middle East & Africa decor paper market is analyzed and market size information is provided by the country, product type, weight, color, application, raw materials, end-use and industry as referenced above.
The countries covered in the Middle East & Africa decor paper market report are the South Africa, Israel, U.A.E., Saudi Arabia, Egypt, and Rest of Middle East & Africa.
U.A.E. dominates the Middle East & Africa region due to the high requirement in the housing industry and paper manufacture in the region.
The country section of the report also provides individual market impacting factors and changes in regulation in the market domestically that impacts the current and future trends of the market. Data points such as new sales, replacement sales, country demographics, regulatory acts and import-export tariffs are some of the major pointers used to forecast the market scenario for individual countries. Also, presence and availability of Middle East & Africa brands and their challenges faced due to large or scarce competition from local and domestic brands, impact of sales channels are considered while providing forecast analysis of the country data.
Rise in Technological Advancement to Increase Vehicle Performance is Boosting the Market Growth
The Middle East & Africa decor paper market also provides you with detailed market analysis for every country growth in particular market. Additionally, it provides the detail information regarding the market players’ strategy and their geographical presence. The data is available for historic period 2011 to 2020.
Competitive Landscape and Decor Paper Market Share Analysis
Middle East & Africa decor paper market competitive landscape provides details by competitor. Details included are company overview, company financials, revenue generated, market potential, investment in research and development, new market initiatives, production sites and facilities, company strengths and weaknesses, product launch, product trials pipelines, product approvals, patents, product width and breadth, application dominance, technology lifeline curve. The above data points provided are only related to the companies’ focus related to Middle East & Africa decor paper market.
- Some of the major players operating in the Middle East & Africa decor paper market are KÄMMERER Paper GmbH, SURTECO GmbH, Ahlstrom-Munksjö, Schattdecor , Pudumjee Paper Products, Lamigraf, Felix Schoeller Group, Impress Surfaces GmbH, Pura Group, Comtrad Strategic Sourcing, DIC CORPORATION (2021), TOPPAN INC., Stora Enso, CHIYODA, Ved Cellulose Ltd, KJ SPECIALITY PAPER Co., Ltd.
Many contracts and agreements are also initiated by the companies’ worldwide which are also accelerating the Middle East & Africa decor paper market growth.
For instance,
- In October 2021, Neenah Paper and Packaging announced that they have acquired of FiberMark, a manufacturer and global distributor of specialty cellulose and synthetic fiber-based printing media. Alter acquisition the customers can have immediate access to thousands of colors, textures, finishes and weights in premium papers, box wraps, folding boards and labels. Thus this will help company to expand kits paper and packaging portfolio.
- In January 2021, Lamigraf announced that they have signed an agreement with Rotodecor GmbH for the purchase of two gravure printing presses for its new factory in Changzhou (China). The investment will help the company to strengthen its position in Chinese market. Thus the company will be able to expand its manufacturing capabilities.
SKU-

- Interactive Data Analysis Dashboard
- Company Analysis Dashboard for high growth potential opportunities
- Research Analyst Access for customization & queries
- Competitor Analysis with Interactive dashboard
- Latest News, Updates & Trend analysis
- Harness the Power of Benchmark Analysis for Comprehensive Competitor Tracking
Table of Content
1 INTRODUCTION
1.1 OBJECTIVES OF THE STUDY
1.2 MARKET DEFINITION
1.3 OVERVIEW OF MIDDLE EAST & AFRICA DECOR PAPER MARKET
1.4 CURRENCY AND PRICING
1.5 LIMITATIONS
1.6 MARKETS COVERED
2 MARKET SEGMENTATION
2.1 MARKETS COVERED
2.2 GEOGRAPHICAL SCOPE
2.3 YEARS CONSIDERED FOR THE STUDY
2.4 DBMR TRIPOD DATA VALIDATION MODEL
2.5 PRIMARY INTERVIEWS WITH KEY OPINION LEADERS
2.6 DBMR MARKET POSITION GRID
2.7 VENDOR SHARE ANALYSIS
2.8 MULTIVARIATE MODELING
2.9 PRODUCT TYPE TIMELINE CURVE
2.1 MARKET APPLICATION GRID
2.11 SECONDARY SOURCES
2.12 ASSUMPTIONS
3 EXECUTIVE SUMMARY
4 PREMIUM INSIGHTS
5 MARKET OVERVIEW
5.1 DRIVERS
5.1.1 ACCELERATION URBANIZATION AND CONSUMER PREFERENCES TOWARD MODERN PRODUCT DESIGNS IN HOME DECOR
5.1.2 RISING DEMAND FOR THE INTERIOR DESIGN IN BUILDINGS ACROSS THE REGION
5.1.3 LOW PRODUCT COST WITH HIGHER STRENGTH AND DURABILITY
5.2 RESTRAINTS
5.2.1 STRINGENT GOVERNMENT NORMS & REGULATIONS REGARDING DEFORESTATION
5.2.2 RISE IN CONCERNS OF DUST AND HARMFUL EMISSIONS IN THE DECOR PAPER PRODUCTION
5.3 OPPORTUNITIES
5.3.1 FUNDAMENTAL SHIFT OF DEMAND FOR HOME DECOR AMID THE PANDEMIC
5.3.2 INCREASE IN ACQUISITION AND PARTNERSHIPS BETWEEN ORGANIZATIONS IN EMERGING COUNTRIES
5.4 CHALLENGES
5.4.1 SHORTAGE OF RAW MATERIALS FOR DECOR PAPER PRODUCTION
5.4.2 FLUCTUATION OF RAW MATERIAL PRICES AND SUPPLY CHAIN INCONSISTENCY
5.4.3 LACK OF SKILLED LABOR AND FINANCIAL LOSSES IN PAPER MAKING INDUSTRY
6 IMPACT OF COVID-19 ON THE MIDDLE EAST & AFRICA DECOR PAPER MARKET
6.1 ANALYSIS ON IMPACT OF COVID-19 ON THE MARKET
6.2 STRATEGIC DECISION BY MANUFACTURERS AND GOVERNMENT INITIATIVES AFTER COVID-19
6.3 IMPACT ON DEMAND
6.4 IMPACT ON PRICE
6.5 IMPACT ON SUPPLY CHAIN
6.6 CONCLUSION
7 MIDDLE EAST & AFRICA DECOR PAPER MARKET, BY PRODUCT TYPE
7.1 OVERVIEW
7.2 PRINT BASE PAPER
7.3 ABSORBENT KRAFT PAPER
7.4 BASE PAPER FOR FOIL PRODUCTION
7.5 EDGE BANDING PAPER
7.6 UNI PAPERS
7.7 OTHERS
8 MIDDLE EAST & AFRICA DECOR PAPER MARKET, BY WEIGHT
8.1 OVERVIEW
8.2 LESS THAN 65 GSM
8.3 65-80 GSM
8.4 81-100 GSM
8.5 ABOVE 100 GSM
9 MIDDLE EAST & AFRICA DECOR PAPER MARKET, BY COLOR
9.1 OVERVIEW
9.2 BROWN
9.3 WHITE
9.4 BLACK
9.5 CREAM
9.6 BEIGE
9.7 GRAY
9.8 OTHERS
10 MIDDLE EAST & AFRICA DECOR PAPER MARKET, BY APPLICATION
10.1 OVERVIEW
10.2 HIGH-PRESSURE LAMINATES
10.3 LOW-PRESSURE LAMINATES
10.4 CONTINUOUS PRESSURE LAMINATES
11 MIDDLE EAST & AFRICA DECOR PAPER MARKET, BY RAW MATERIALS
11.1 OVERVIEW
11.2 PULP
11.3 COATING
11.4 ADDITIVES
11.5 FILLERS & BINDERS
11.6 OTHERS
12 MIDDLE EAST & AFRICA DECOR PAPER MARKET, BY END USE
12.1 OVERVIEW
12.2 FLOORING
12.2.1 COMMERCIAL TYPE
12.2.2 HOUSEHOLD TYPE
12.3 WALLPAPER
12.3.1 COMMERCIAL TYPE
12.3.2 HOUSEHOLD TYPE
12.4 FURNITURE AND CABINETS
12.4.1 COMMERCIAL TYPE
12.4.2 HOUSEHOLD TYPE
12.5 WALLCOVERING LAMINATES
12.5.1 COMMERCIAL TYPE
12.5.2 HOUSEHOLD TYPE
12.6 PANELLING
12.6.1 COMMERCIAL TYPE
12.6.2 HOUSEHOLD TYPE
12.7 STORE FIXTURE
12.7.1 COMMERCIAL TYPE
12.7.2 HOUSEHOLD TYPE
12.8 DIRECT PRINTING
12.8.1 COMMERCIAL TYPE
12.8.2 HOUSEHOLD TYPE
13 MIDDLE EAST & AFRICA DECOR PAPER MARKET, BY INDUSTRY
13.1 OVERVIEW
13.2 COMMERCIAL TYPE
13.2.1 HOSPITALITY
13.2.2 RETAIL OUTLETS/SHOPPING MALLS
13.2.3 BARS, PUBS & HOTELS
13.2.4 TRANSPORT HUBS
13.2.5 ENTERTAINMENT VENUES
13.2.6 OFFICES
13.2.7 CAFÉ
13.2.8 OTHERS
13.3 HOUSEHOLD TYPE
14 MIDDLE EAST & AFRICA DECOR PAPER MARKET, BY REGION
14.1 MIDDLE EAST AND AFRICA
14.1.1 UAE
14.1.2 SAUDI ARABIA
14.1.3 ISRAEL
14.1.4 EGYPT
14.1.5 SOUTH AFRICA
14.1.6 REST OF MIDDLE EAST AND AFRICA
15 MIDDLE EAST & AFRICA DECOR PAPER MARKET, COMPANY LANDSCAPE
15.1 COMPANY SHARE ANALYSIS: MIDDLE EAST & AFRICA
16 SWOT ANALYSIS
17 COMPANY PROFILE
17.1 SURTECO GMBH
17.1.1 COMPANY SNAPSHOT
17.1.2 REVENUE ANALYSIS
17.1.3 COMPANY SHARE ANALYSIS
17.1.4 PRODUCT PORTFOLIO
17.1.5 RECENT DEVELOPMENTS
17.2 TOPPAN INC.
17.2.1 COMPANY SNAPSHOT
17.2.2 REVENUE ANALYSIS
17.2.3 COMPANY SHARE ANALYSIS
17.2.4 PRODUCT PORTFOLIO
17.2.5 RECENT DEVELOPMENTS
17.3 KOEHLER PAPER SE
17.3.1 COMPANY SNAPSHOT
17.3.2 COMPANY SHARE ANALYSIS
17.3.3 PRODUCT PORTFOLIO
17.3.4 RECENT DEVELOPMENTS
17.4 AHLSTROM-MUNKSJÖ
17.4.1 COMPANY SNAPSHOT
17.4.2 REVENUE ANALYSIS
17.4.3 COMPANY SHARE ANALYSIS
17.4.4 PRODUCT PORTFOLIO
17.4.5 RECENT DEVELOPMENT
17.5 SCHATTDECOR
17.5.1 COMPANY SNAPSHOT
17.5.2 PRODUCT PORTFOLIO
17.5.3 RECENT DEVELOPMENT
17.6 FELIX SCHOELLER GROUP
17.6.1 COMPANY SNAPSHOT
17.6.2 COMPANY SHARE ANALYSIS
17.6.3 PRODUCT PORTFOLIO
17.6.4 RECENT DEVELOPMENTS
17.7 BMK GMBH
17.7.1 COMPANY SNAPSHOT
17.7.2 PRODUCT PORTFOLIO
17.7.3 RECENT DEVELOPMENT
17.8 COMTRAD STRATEGIC SOURCING
17.8.1 COMPANY SNAPSHOT
17.8.2 PRODUCT PORTFOLIO
17.8.3 RECENT DEVELOPMENT
17.9 CHIYODA
17.9.1 COMPANY SNAPSHOT
17.9.2 PRODUCT PORTFOLIO
17.9.3 RECENT DEVELOPMENTS
17.1 DIC CORPORATION
17.10.1 COMPANY SNAPSHOT
17.10.2 REVENUE ANALYSIS
17.10.3 PRODUCT PORTFOLIO
17.10.4 RECENT DEVELOPMENTS
17.11 IMPRESS SURFACES GMBH
17.11.1 COMPANY SNAPSHOT
17.11.2 PRODUCT PORTFOLIO
17.11.3 RECENT DEVELOPMENTS
17.12 KÄMMERER PAPER GMBH
17.12.1 COMPANY SNAPSHOT
17.12.2 PRODUCT PORTFOLIO
17.12.3 RECENT DEVELOPMENTS
17.13 KJ SPECIALITY PAPER CO., LTD.
17.13.1 COMPANY SNAPSHOT
17.13.2 PRODUCT PORTFOLIO
17.14 LAMIGRAF
17.14.1 COMPANY SNAPSHOT
17.14.2 PRODUCT PORTFOLIO
17.14.3 RECENT DEVELOPMENTS
17.15 NEENAH PAPER AND PACKAGING
17.15.1 COMPANY SNAPSHOT
17.15.2 PRODUCT PORTFOLIO
17.15.3 RECENT DEVELOPMENT
17.16 ONYX PAPERS
17.16.1 COMPANY SNAPSHOT
17.16.2 PRODUCT PORTFOLIO
17.16.3 RECENT DEVELOPMENT
17.17 PUDUMJEE PAPER PRODUCTS
17.17.1 COMPANY SNAPSHOT
17.17.2 REVENUE ANALYSIS
17.17.3 PRODUCT PORTFOLIO
17.17.4 RECENT DEVELOPMENTS
17.18 PURA GROUP
17.18.1 COMPANY SNAPSHOT
17.18.2 PRODUCT PORTFOLIO
17.18.3 RECENT DEVELOPMENTS
17.19 STORA ENSO
17.19.1 COMPANY SNAPSHOT
17.19.2 REVENUE ANALYSIS
17.19.3 PRODUCT PORTFOLIO
17.19.4 RECENT DEVELOPMENTS
17.2 TOPPAN INC.
17.20.1 COMPANY SNAPSHOT
17.20.2 REVENUE ANALYSIS
17.20.3 PRODUCT PORTFOLIO
17.20.4 RECENT DEVELOPMENTS
17.21 VED CELLULOSE LTD
17.21.1 COMPANY SNAPSHOT
17.21.2 PRODUCT PORTFOLIO
18 QUESTIONNAIRE
19 RELATED REPORTS
List of Table
TABLE 1 MIDDLE EAST & AFRICA DECOR PAPER MARKET, BY PRODUCT TYPE, 2020-2029 (USD MILLION)
TABLE 2 MIDDLE EAST & AFRICA PRINT BASE PAPER IN DECOR PAPER MARKET, BY REGION, 2020-2029 (USD MILLION)
TABLE 3 MIDDLE EAST & AFRICA ABSORBENT KRAFT PAPER IN DECOR PAPER MARKET, BY REGION, 2020-2029 (USD MILLION)
TABLE 4 MIDDLE EAST & AFRICA BASE PAPER FOR FOIL PRODUCTION IN DECOR PAPER MARKET, BY REGION, 2020-2029 (USD MILLION)
TABLE 5 MIDDLE EAST & AFRICA EDGE BANDING PAPER IN DECOR PAPER MARKET, BY REGION, 2020-2029 (USD MILLION)
TABLE 6 MIDDLE EAST & AFRICA UNI PAPER IN DECOR PAPER MARKET, BY REGION, 2020-2029 (USD MILLION)
TABLE 7 MIDDLE EAST & AFRICA OTHERS IN DECOR PAPER MARKET, BY REGION, 2020-2029 (USD MILLION)
TABLE 8 MIDDLE EAST & AFRICA DECOR PAPER MARKET, BY WEIGHT, 2020-2029 (USD MILLION)
TABLE 9 MIDDLE EAST & AFRICA LESS THAN 65 GSM IN DECOR PAPER MARKET, BY REGION, 2020-2029 (USD MILLION)
TABLE 10 MIDDLE EAST & AFRICA 65-80 GSM IN DECOR PAPER MARKET, BY REGION, 2020-2029 (USD MILLION)
TABLE 11 MIDDLE EAST & AFRICA 81-100 GSM IN DECOR PAPER MARKET, BY REGION, 2020-2029 (USD MILLION)
TABLE 12 MIDDLE EAST & AFRICA ABOVE 100 GSM IN DECOR PAPER MARKET, BY REGION, 2020-2029 (USD MILLION)
TABLE 13 MIDDLE EAST & AFRICA DECOR PAPER MARKET, BY COLOR, 2020-2029 (USD MILLION)
TABLE 14 MIDDLE EAST & AFRICA BROWN IN DECOR PAPER MARKET, BY REGION, 2020-2029 (USD MILLION)
TABLE 15 MIDDLE EAST & AFRICA WHITE IN DECOR PAPER MARKET, BY REGION, 2020-2029 (USD MILLION)
TABLE 16 MIDDLE EAST & AFRICA BLACK IN DECOR PAPER MARKET, BY REGION, 2020-2029 (USD MILLION)
TABLE 17 MIDDLE EAST & AFRICA CREAM IN DECOR PAPER MARKET, BY REGION, 2020-2029 (USD MILLION)
TABLE 18 MIDDLE EAST & AFRICA BEIGE IN DECOR PAPER MARKET, BY REGION, 2020-2029 (USD MILLION)
TABLE 19 MIDDLE EAST & AFRICA GRAY IN DECOR PAPER MARKET, BY REGION, 2020-2029 (USD MILLION)
TABLE 20 MIDDLE EAST & AFRICA OTHERS IN DECOR PAPER MARKET, BY REGION, 2020-2029 (USD MILLION)
TABLE 21 MIDDLE EAST & AFRICA DECOR PAPER MARKET, BY APPLICATION, 2020-2029 (USD MILLION)
TABLE 22 MIDDLE EAST & AFRICA HIGH-PRESSURE LAMINATES IN DECOR PAPER MARKET, BY REGION, 2020-2029 (USD MILLION)
TABLE 23 MIDDLE EAST & AFRICA LOW-PRESSURE LAMINATES IN DECOR PAPER MARKET, BY REGION, 2020-2029 (USD MILLION)
TABLE 24 MIDDLE EAST & AFRICA CONTINUOUS PRESSURE LAMINATES IN DECOR PAPER MARKET, BY REGION, 2020-2029 (USD MILLION)
TABLE 25 MIDDLE EAST & AFRICA DECOR PAPER MARKET, BY RAW MATERIALS, 2020-2029 (USD MILLION)
TABLE 26 MIDDLE EAST & AFRICA PULP IN DECOR PAPER MARKET, BY REGION, 2020-2029 (USD MILLION)
TABLE 27 MIDDLE EAST & AFRICA COATING IN DECOR PAPER MARKET, BY REGION, 2020-2029 (USD MILLION)
TABLE 28 MIDDLE EAST & AFRICA ADDITIVES IN DECOR PAPER MARKET, BY REGION, 2020-2029 (USD MILLION)
TABLE 29 MIDDLE EAST & AFRICA FILLERS & BINDERS IN DECOR PAPER MARKET, BY REGION, 2020-2029 (USD MILLION)
TABLE 30 MIDDLE EAST & AFRICA OTHERS IN DECOR PAPER MARKET, BY REGION, 2020-2029 (USD MILLION)
TABLE 31 MIDDLE EAST & AFRICA DECOR PAPER MARKET, BY END USE, 2020-2029 (USD MILLION)
TABLE 32 MIDDLE EAST & AFRICA FLOORING IN DECOR PAPER MARKET, BY REGION, 2020-2029 (USD MILLION)
TABLE 33 MIDDLE EAST & AFRICA FLOORING IN DECOR PAPER MARKET, BY TYPE, 2020-2029 (USD MILLION)
TABLE 34 MIDDLE EAST & AFRICA WALLPAPER IN DECOR PAPER MARKET, BY REGION, 2020-2029 (USD MILLION)
TABLE 35 MIDDLE EAST & AFRICA WALLPAPER IN DECOR PAPER MARKET, BY TYPE, 2020-2029 (USD MILLION)
TABLE 36 MIDDLE EAST & AFRICA FURNITURE AND CABINETS IN DECOR PAPER MARKET, BY REGION, 2020-2029 (USD MILLION)
TABLE 37 MIDDLE EAST & AFRICA FURNITURE AND CABINETS IN DECOR PAPER MARKET, BY TYPE, 2020-2029 (USD MILLION)
TABLE 38 MIDDLE EAST & AFRICA WALLCOVERING LAMINATES IN DECOR PAPER MARKET, BY REGION, 2020-2029 (USD MILLION)
TABLE 39 MIDDLE EAST & AFRICA WALLCOVERING LAMINATES IN DECOR PAPER MARKET, BY TYPE, 2020-2029 (USD MILLION)
TABLE 40 MIDDLE EAST & AFRICA PANELLING IN DECOR PAPER MARKET, BY REGION, 2020-2029 (USD MILLION)
TABLE 41 MIDDLE EAST & AFRICA PANELLING IN DECOR PAPER MARKET, BY TYPE, 2020-2029 (USD MILLION)
TABLE 42 MIDDLE EAST & AFRICA STORE FIXTURE IN DECOR PAPER MARKET, BY REGION, 2020-2029 (USD MILLION)
TABLE 43 MIDDLE EAST & AFRICA STORE FIXTURE IN DECOR PAPER MARKET, BY TYPE, 2020-2029 (USD MILLION)
TABLE 44 MIDDLE EAST & AFRICA DIRECT PRINTING IN DECOR PAPER MARKET, BY REGION , 2020-2029 (USD MILLION)
TABLE 45 MIDDLE EAST & AFRICA DIRECT PRINTING IN DECOR PAPER MARKET, BY TYPE, 2020-2029 (USD MILLION)
TABLE 46 MIDDLE EAST & AFRICA DECOR PAPER MARKET, BY INDUSTRY, 2020-2029 (USD MILLION)
TABLE 47 MIDDLE EAST & AFRICA COMMERCIAL TYPE IN DECOR PAPER MARKET, BY REGION, 2020-2029 (USD MILLION)
TABLE 48 MIDDLE EAST & AFRICA COMMERCIAL TYPE IN DECOR PAPER MARKET, BY TYPE, 2020-2029 (USD MILLION)
TABLE 49 MIDDLE EAST & AFRICA HOUSEHOLD TYPE IN DECOR PAPER MARKET, BY REGION , 2020-2029 (USD MILLION)
TABLE 50 MIDDLE EAST AND AFRICA DECOR PAPER MARKET, BY COUNTRY, 2020-2029 (USD MILLION)
TABLE 51 MIDDLE EAST AND AFRICA DECOR PAPER MARKET, BY COUNTRY, 2020-2029 (MILLION TONS)
TABLE 52 MIDDLE EAST AND AFRICA DECOR PAPER MARKET, BY PRODUCT TYPE, 2020-2029 (USD MILLION)
TABLE 53 MIDDLE EAST AND AFRICA DECOR PAPER MARKET, BY PRODUCT TYPE, 2020-2029 (MILLION TONS)
TABLE 54 MIDDLE EAST AND AFRICA DECOR PAPER MARKET, BY WEIGHT, 2020-2029 (USD MILLION)
TABLE 55 MIDDLE EAST AND AFRICA DECOR PAPER MARKET, BY COLOR, 2020-2029 (USD MILLION)
TABLE 56 MIDDLE EAST AND AFRICA DECOR PAPER MARKET, BY APPLICATION, 2020-2029 (USD MILLION)
TABLE 57 MIDDLE EAST AND AFRICA DECOR PAPER MARKET, BY RAW MATERIAL, 2020-2029 (USD MILLION)
TABLE 58 MIDDLE EAST AND AFRICA DECOR PAPER MARKET, BY END-USE, 2020-2029 (USD MILLION)
TABLE 59 MIDDLE EAST AND AFRICA FLOORING IN DECOR PAPER MARKET, BY TYPE, 2020-2029 (USD MILLION)
TABLE 60 MIDDLE EAST AND AFRICA WALLPAPER IN DECOR PAPER MARKET, BY TYPE, 2020-2029 (USD MILLION)
TABLE 61 MIDDLE EAST AND AFRICA FURNITURE AND CABINETS IN DECOR PAPER MARKET, BY TYPE, 2020-2029 (USD MILLION)
TABLE 62 MIDDLE EAST AND AFRICA WALLCOVERING LAMINATES IN DECOR PAPER MARKET, BY TYPE, 2020-2029 (USD MILLION)
TABLE 63 MIDDLE EAST AND AFRICA PANELLING IN DECOR PAPER MARKET, BY TYPE, 2020-2029 (USD MILLION)
TABLE 64 MIDDLE EAST AND AFRICA STORE FIXTURE IN DECOR PAPER MARKET, BY TYPE, 2020-2029 (USD MILLION)
TABLE 65 MIDDLE EAST AND AFRICA DIRECT PRINTING IN DECOR PAPER MARKET, BY TYPE, 2020-2029 (USD MILLION)
TABLE 66 MIDDLE EAST AND AFRICA DECOR PAPER MARKET, BY INDUSTRY, 2020-2029 (USD MILLION)
TABLE 67 MIDDLE EAST AND AFRICA COMMERCIAL TYPE IN DECOR PAPER MARKET, BY TYPE, 2020-2029 (USD MILLION)
TABLE 68 UAE DECOR PAPER MARKET, BY PRODUCT TYPE, 2020-2029 (USD MILLION)
TABLE 69 UAE DECOR PAPER MARKET, BY TYPE, 2020-2029 (MILLION TONS)
TABLE 70 UAE DECOR PAPER MARKET, BY WEIGHT, 2020-2029 (USD MILLION)
TABLE 71 UAE DECOR PAPER MARKET, BY COLOR, 2020-2029 (USD MILLION)
TABLE 72 UAE DECOR PAPER MARKET, BY APPLICATION, 2020-2029 (USD MILLION)
TABLE 73 UAE DECOR PAPER MARKET, BY RAW MATERIAL, 2020-2029 (USD MILLION)
TABLE 74 UAE DECOR PAPER MARKET, BY END-USE, 2020-2029 (USD MILLION)
TABLE 75 UAE FLOORING IN DECOR PAPER MARKET, BY TYPE, 2020-2029 (USD MILLION)
TABLE 76 UAE WALLPAPER IN DECOR PAPER MARKET, BY TYPE, 2020-2029 (USD MILLION)
TABLE 77 UAE FURNITURE AND CABINETS IN DECOR PAPER MARKET, BY TYPE, 2020-2029 (USD MILLION)
TABLE 78 UAE WALLCOVERING LAMINATES IN DECOR PAPER MARKET, BY TYPE, 2020-2029 (USD MILLION)
TABLE 79 UAE PANELLING IN DECOR PAPER MARKET, BY TYPE, 2020-2029 (USD MILLION)
TABLE 80 UAE STORE FIXTURE IN DECOR PAPER MARKET, BY TYPE, 2020-2029 (USD MILLION)
TABLE 81 UAE DIRECT PRINTING IN DECOR PAPER MARKET, BY TYPE, 2020-2029 (USD MILLION)
TABLE 82 UAE DECOR PAPER MARKET, BY INDUSTRY, 2020-2029 (USD MILLION)
TABLE 83 UAE COMMERCIAL TYPE IN DECOR PAPER MARKET, BY TYPE, 2020-2029 (USD MILLION)
TABLE 84 SAUDI ARABIA DECOR PAPER MARKET, BY PRODUCT TYPE, 2020-2029 (USD MILLION)
TABLE 85 SAUDI ARABIA DECOR PAPER MARKET, BY PRODUCT TYPE, 2020-2029 (MILLION TONS)
TABLE 86 SAUDI ARABIA DECOR PAPER MARKET, BY WEIGHT, 2020-2029 (USD MILLION)
TABLE 87 SAUDI ARABIA DECOR PAPER MARKET, BY COLOR, 2020-2029 (USD MILLION)
TABLE 88 SAUDI ARABIA DECOR PAPER MARKET, BY APPLICATION, 2020-2029 (USD MILLION)
TABLE 89 SAUDI ARABIA DECOR PAPER MARKET, BY RAW MATERIAL, 2020-2029 (USD MILLION)
TABLE 90 SAUDI ARABIA DECOR PAPER MARKET, BY END-USE, 2020-2029 (USD MILLION)
TABLE 91 SAUDI ARABIA FLOORING IN DECOR PAPER MARKET, BY TYPE, 2020-2029 (USD MILLION)
TABLE 92 SAUDI ARABIA WALLPAPER IN DECOR PAPER MARKET, BY TYPE, 2020-2029 (USD MILLION)
TABLE 93 SAUDI ARABIA FURNITURE AND CABINETS IN DECOR PAPER MARKET, BY TYPE, 2020-2029 (USD MILLION)
TABLE 94 SAUDI ARABIA WALLCOVERING LAMINATES IN DECOR PAPER MARKET, BY TYPE, 2020-2029 (USD MILLION)
TABLE 95 SAUDI ARABIA PANELLING IN DECOR PAPER MARKET, BY TYPE, 2020-2029 (USD MILLION)
TABLE 96 SAUDI ARABIA STORE FIXTURE IN DECOR PAPER MARKET, BY TYPE, 2020-2029 (USD MILLION)
TABLE 97 SAUDI ARABIA DIRECT PRINTING IN DECOR PAPER MARKET, BY TYPE, 2020-2029 (USD MILLION)
TABLE 98 SAUDI ARABIA DECOR PAPER MARKET, BY INDUSTRY, 2020-2029 (USD MILLION)
TABLE 99 SAUDI ARABIA COMMERCIAL TYPE IN DECOR PAPER MARKET, BY TYPE, 2020-2029 (USD MILLION)
TABLE 100 ISRAEL DECOR PAPER MARKET, BY PRODUCT TYPE, 2020-2029 (USD MILLION)
TABLE 101 ISRAEL DECOR PAPER MARKET, BY PRODUCT TYPE, 2020-2029 (MILLION TONS)
TABLE 102 ISRAEL DECOR PAPER MARKET, BY WEIGHT, 2020-2029 (USD MILLION)
TABLE 103 ISRAEL DECOR PAPER MARKET, BY COLOR, 2020-2029 (USD MILLION)
TABLE 104 ISRAEL DECOR PAPER MARKET, BY APPLICATION, 2020-2029 (USD MILLION)
TABLE 105 ISRAEL DECOR PAPER MARKET, BY RAW MATERIAL, 2020-2029 (USD MILLION)
TABLE 106 ISRAEL DECOR PAPER MARKET, BY END-USE, 2020-2029 (USD MILLION)
TABLE 107 ISRAEL FLOORING IN DECOR PAPER MARKET, BY TYPE, 2020-2029 (USD MILLION)
TABLE 108 ISRAEL WALLPAPER IN DECOR PAPER MARKET, BY TYPE, 2020-2029 (USD MILLION)
TABLE 109 ISRAEL FURNITURE AND CABINETS IN DECOR PAPER MARKET, BY TYPE, 2020-2029 (USD MILLION)
TABLE 110 ISRAEL WALLCOVERING LAMINATES IN DECOR PAPER MARKET, BY TYPE, 2020-2029 (USD MILLION)
TABLE 111 ISRAEL PANELLING IN DECOR PAPER MARKET, BY TYPE, 2020-2029 (USD MILLION)
TABLE 112 ISRAEL STORE FIXTURE IN DECOR PAPER MARKET, BY TYPE, 2020-2029 (USD MILLION)
TABLE 113 ISRAEL DIRECT PRINTING IN DECOR PAPER MARKET, BY TYPE, 2020-2029 (USD MILLION)
TABLE 114 ISRAEL DECOR PAPER MARKET, BY INDUSTRY, 2020-2029 (USD MILLION)
TABLE 115 ISRAEL COMMERCIAL TYPE IN DECOR PAPER MARKET, BY TYPE, 2020-2029 (USD MILLION)
TABLE 116 EGYPT DECOR PAPER MARKET, BY PRODUCT TYPE, 2020-2029 (USD MILLION)
TABLE 117 EGYPT DECOR PAPER MARKET, BY PRODUCT TYPE, 2020-2029 (MILLION TONS)
TABLE 118 EGYPT DECOR PAPER MARKET, BY WEIGHT, 2020-2029 (USD MILLION)
TABLE 119 EGYPT DECOR PAPER MARKET, BY COLOR, 2020-2029 (USD MILLION)
TABLE 120 EGYPT DECOR PAPER MARKET, BY APPLICATION, 2020-2029 (USD MILLION)
TABLE 121 EGYPT DECOR PAPER MARKET, BY RAW MATERIAL, 2020-2029 (USD MILLION)
TABLE 122 EGYPT DECOR PAPER MARKET, BY END-USE, 2020-2029 (USD MILLION)
TABLE 123 EGYPT FLOORING IN DECOR PAPER MARKET, BY TYPE, 2020-2029 (USD MILLION)
TABLE 124 EGYPT WALLPAPER IN DECOR PAPER MARKET, BY TYPE, 2020-2029 (USD MILLION)
TABLE 125 EGYPT FURNITURE AND CABINETS IN DECOR PAPER MARKET, BY TYPE, 2020-2029 (USD MILLION)
TABLE 126 EGYPT WALLCOVERING LAMINATES IN DECOR PAPER MARKET, BY TYPE, 2020-2029 (USD MILLION)
TABLE 127 EGYPT PANELLING IN DECOR PAPER MARKET, BY TYPE, 2020-2029 (USD MILLION)
TABLE 128 EGYPT STORE FIXTURE IN DECOR PAPER MARKET, BY TYPE, 2020-2029 (USD MILLION)
TABLE 129 EGYPT DIRECT PRINTING IN DECOR PAPER MARKET, BY TYPE, 2020-2029 (USD MILLION)
TABLE 130 EGYPT DECOR PAPER MARKET, BY INDUSTRY, 2020-2029 (USD MILLION)
TABLE 131 EGYPT COMMERCIAL TYPE IN DECOR PAPER MARKET, BY TYPE, 2020-2029 (USD MILLION)
TABLE 132 SOUTH AFRICA DECOR PAPER MARKET, BY PRODUCT TYPE, 2020-2029 (USD MILLION)
TABLE 133 SOUTH AFRICA DECOR PAPER MARKET, BY PRODUCT TYPE, 2020-2029 (MILLION TONS)
TABLE 134 SOUTH AFRICA DECOR PAPER MARKET, BY WEIGHT, 2020-2029 (USD MILLION)
TABLE 135 SOUTH AFRICA DECOR PAPER MARKET, BY COLOR, 2020-2029 (USD MILLION)
TABLE 136 SOUTH AFRICA DECOR PAPER MARKET, BY APPLICATION, 2020-2029 (USD MILLION)
TABLE 137 SOUTH AFRICA DECOR PAPER MARKET, BY RAW MATERIAL, 2020-2029 (USD MILLION)
TABLE 138 SOUTH AFRICA DECOR PAPER MARKET, BY END-USE, 2020-2029 (USD MILLION)
TABLE 139 SOUTH AFRICA FLOORING IN DECOR PAPER MARKET, BY TYPE, 2020-2029 (USD MILLION)
TABLE 140 SOUTH AFRICA WALLPAPER IN DECOR PAPER MARKET, BY TYPE, 2020-2029 (USD MILLION)
TABLE 141 SOUTH AFRICA FURNITURE AND CABINETS IN DECOR PAPER MARKET, BY TYPE, 2020-2029 (USD MILLION)
TABLE 142 SOUTH AFRICA WALLCOVERING LAMINATES IN DECOR PAPER MARKET, BY TYPE, 2020-2029 (USD MILLION)
TABLE 143 SOUTH AFRICA PANELLING IN DECOR PAPER MARKET, BY TYPE, 2020-2029 (USD MILLION)
TABLE 144 SOUTH AFRICA STORE FIXTURE IN DECOR PAPER MARKET, BY TYPE, 2020-2029 (USD MILLION)
TABLE 145 SOUTH AFRICA DIRECT PRINTING IN DECOR PAPER MARKET, BY TYPE, 2020-2029 (USD MILLION)
TABLE 146 SOUTH AFRICA DECOR PAPER MARKET, BY INDUSTRY, 2020-2029 (USD MILLION)
TABLE 147 SOUTH AFRICA COMMERCIAL TYPE IN DECOR PAPER MARKET, BY TYPE, 2020-2029 (USD MILLION)
TABLE 148 REST OF MIDDLE EAST AND AFRICA DECOR PAPER MARKET, BY PRODUCT TYPE, 2020-2029 (USD MILLION)
TABLE 149 REST OF MIDDLE EAST AND AFRICA DECOR PAPER MARKET, BY PRODUCT TYPE, 2020-2029 (MILLION TONS)
List of Figure
FIGURE 1 MIDDLE EAST & AFRICA DECOR PAPER MARKET: SEGMENTATION
FIGURE 2 MIDDLE EAST & AFRICA DECOR PAPER MARKET: DATA TRIANGULATION
FIGURE 3 MIDDLE EAST & AFRICA DECOR PAPER MARKET: DROC ANALYSIS
FIGURE 4 MIDDLE EAST & AFRICA DECOR PAPER MARKET: MIDDLE EAST & AFRICA VS REGIONAL MARKET ANALYSIS
FIGURE 5 MIDDLE EAST & AFRICA DECOR PAPER MARKET: COMPANY RESEARCH ANALYSIS
FIGURE 6 MIDDLE EAST & AFRICA DECOR PAPER MARKET: INTERVIEW DEMOGRAPHICS
FIGURE 7 MIDDLE EAST & AFRICA DECOR PAPER MARKET: DBMR MARKET POSITION GRID
FIGURE 8 MIDDLE EAST & AFRICA DECOR PAPER MARKET: VENDOR SHARE ANALYSIS
FIGURE 9 MIDDLE EAST & AFRICA DECOR PAPER MARKET: MARKET APPLICATION COVERAGE GRID
FIGURE 10 MIDDLE EAST & AFRICA DECOR PAPER MARKET: SEGMENTATION
FIGURE 11 RISING DEMAND FOR INTERIOR DESIGNING IN BUILDINGS IS EXPECTED TO DRIVE THE MIDDLE EAST & AFRICA DECOR PAPER MARKET IN THE FORECAST PERIOD OF 2022 -2029
FIGURE 12 PRODUCT TYPE SEGMENT IS EXPECTED TO ACCOUNT FOR THE LARGEST SHARE OF THE MIDDLE EAST & AFRICA DECOR PAPER MARKET IN 2022 - 2029
FIGURE 13 ASIA PACIFIC IS EXPECTED TO DOMINATE AND IS THE FASTEST-GROWING REGION IN THE MIDDLE EAST & AFRICA DECOR PAPER MARKET IN THE FORECAST PERIOD OF 2022 TO 2029
FIGURE 14 DRIVERS, RESTRAINTS, OPPORTUNITIES, CHALLENGES FOR MIDDLE EAST & AFRICA DECOR PAPER MARKET
FIGURE 15 EXPENDITURE ON FURNISHINGS, EQUIPMENT AND ROUTINE MAINTENANCE
FIGURE 16 CONSTRUCTION OUTPUT ACTIVITIES IN EUROPEAN UNION (%)
FIGURE 17 MIDDLE EAST & AFRICA DECOR PAPER MARKET: BY PRODUCT TYPE, 2021
FIGURE 18 MIDDLE EAST & AFRICA DECOR PAPER MARKET: BY WEIGHT, 2021
FIGURE 19 MIDDLE EAST & AFRICA DECOR PAPER MARKET: BY COLOR, 2021
FIGURE 20 MIDDLE EAST & AFRICA DECOR PAPER MARKET: BY APPLICATION, 2021
FIGURE 21 MIDDLE EAST & AFRICA DECOR PAPER MARKET: BY RAW MATERIALS, 2021
FIGURE 22 MIDDLE EAST & AFRICA DECOR PAPER MARKET: BY END USE, 2021
FIGURE 23 MIDDLE EAST & AFRICA DECOR PAPER MARKET: BY INDUSTRY, 2021
FIGURE 24 MIDDLE EAST AND AFRICA DECOR PAPER MARKET: SNAPSHOT (2021)
FIGURE 25 MIDDLE EAST AND AFRICA DECOR PAPER MARKET: BY COUNTRY (2021)
FIGURE 26 MIDDLE EAST AND AFRICA DECOR PAPER MARKET: BY COUNTRY (2022 & 2029)
FIGURE 27 MIDDLE EAST AND AFRICA DECOR PAPER MARKET: BY COUNTRY (2021 & 2029)
FIGURE 28 MIDDLE EAST AND AFRICA DECOR PAPER MARKET: BY TECHNOLOGY (2022-2029)
FIGURE 29 MIDDLE EAST & AFRICA DECOR PAPER MARKET: COMPANY SHARE 2021 (%)
Middle East And Africa Decor Paper Market, Supply Chain Analysis and Ecosystem Framework
To support market growth and help clients navigate the impact of geopolitical shifts, DBMR has integrated in-depth supply chain analysis into its Middle East And Africa Decor Paper Market research reports. This addition empowers clients to respond effectively to global changes affecting their industries. The supply chain analysis section includes detailed insights such as Middle East And Africa Decor Paper Market consumption and production by country, price trend analysis, the impact of tariffs and geopolitical developments, and import and export trends by country and HSN code. It also highlights major suppliers with data on production capacity and company profiles, as well as key importers and exporters. In addition to research, DBMR offers specialized supply chain consulting services backed by over a decade of experience, providing solutions like supplier discovery, supplier risk assessment, price trend analysis, impact evaluation of inflation and trade route changes, and comprehensive market trend analysis.
Data collection and base year analysis are done using data collection modules with large sample sizes. The stage includes obtaining market information or related data through various sources and strategies. It includes examining and planning all the data acquired from the past in advance. It likewise envelops the examination of information inconsistencies seen across different information sources. The market data is analysed and estimated using market statistical and coherent models. Also, market share analysis and key trend analysis are the major success factors in the market report. To know more, please request an analyst call or drop down your inquiry.
The key research methodology used by DBMR research team is data triangulation which involves data mining, analysis of the impact of data variables on the market and primary (industry expert) validation. Data models include Vendor Positioning Grid, Market Time Line Analysis, Market Overview and Guide, Company Positioning Grid, Patent Analysis, Pricing Analysis, Company Market Share Analysis, Standards of Measurement, Global versus Regional and Vendor Share Analysis. To know more about the research methodology, drop in an inquiry to speak to our industry experts.
Data Bridge Market Research is a leader in advanced formative research. We take pride in servicing our existing and new customers with data and analysis that match and suits their goal. The report can be customized to include price trend analysis of target brands understanding the market for additional countries (ask for the list of countries), clinical trial results data, literature review, refurbished market and product base analysis. Market analysis of target competitors can be analyzed from technology-based analysis to market portfolio strategies. We can add as many competitors that you require data about in the format and data style you are looking for. Our team of analysts can also provide you data in crude raw excel files pivot tables (Fact book) or can assist you in creating presentations from the data sets available in the report.


