
Middle East And Africa Edible Oils Market
Market Size in USD Million
 USD
4,803.28 Million
USD
8,503.00 Million
2021
2029
USD
4,803.28 Million
USD
8,503.00 Million
2021
2029
| 2022 - 2029 | |
| USD 4,803.28 Million | |
| USD 8,503.00 Million | |
| % | |
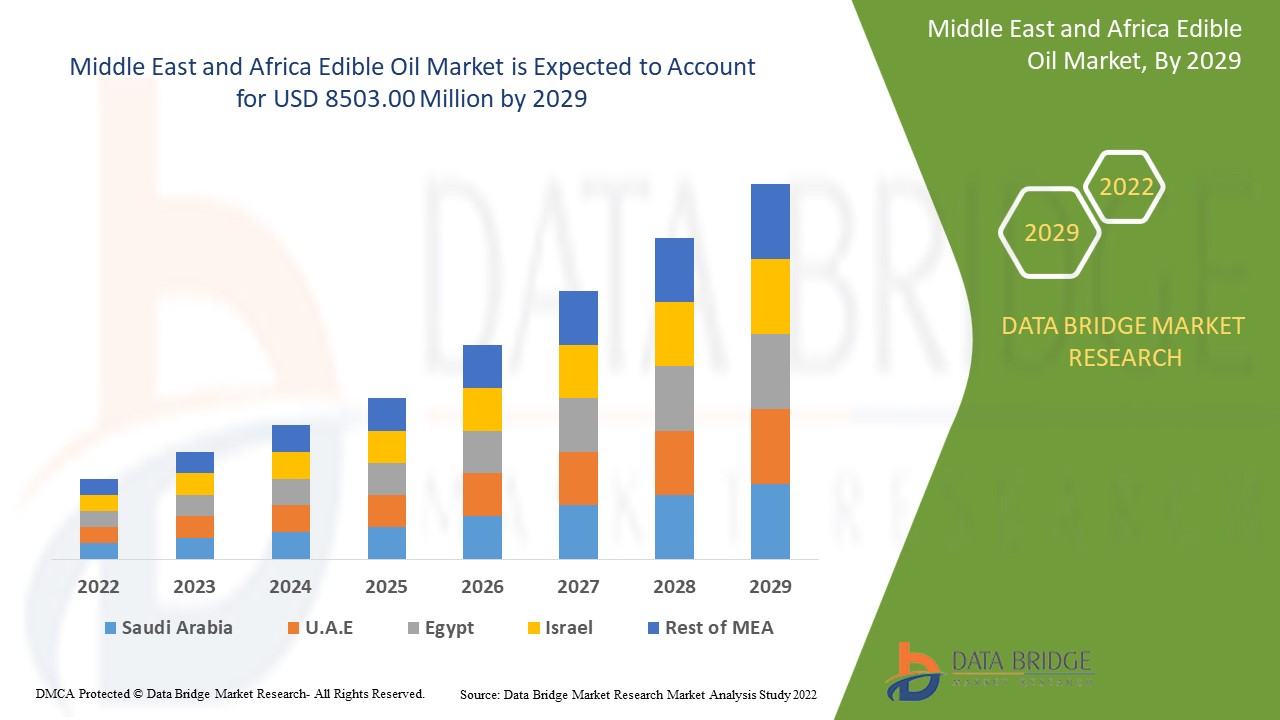
Market Analysis and Size
Edible oil has made a significant place in the food and beverage sector around the world. It is being consumed everyday by millions of people in restaurants, cafeterias, and hotels, among others. Manufacturers are working on developing these oils to offer healthier options to the consumers.
Middle East and Africa Edible Oil Market was valued at USD 4,803.28 million in 2021 and is expected to reach USD 8503.00 million by 2029, registering a CAGR of 7.40% during the forecast period of 2022-2029. Domestics accounts for the largest end user segment owing to the high consumption for household purposes. In addition to the market insights such as market value, growth rate, market segments, geographical coverage, market players, and market scenario, the market report curated by the Data Bridge Market Research team also includes in-depth expert analysis, import/export analysis, pricing analysis, production consumption analysis, patent analysis and consumer behaviour.
Market Definition
Edible oil refers to a liquid that is extracted from plants, vegetables and seeds. These type of oils possess fatty acid, anti-antioxidants and phospholipids, among others. The edible oil is widely consumed among humans and food processing industry. This oil is known to have low fats, calories and cholesterol.
Report Scope and Market Segmentation
|
Report Metric |
Details |
|
Forecast Period |
2022 to 2029 |
|
Base Year |
2021 |
|
Historic Years |
2020 (Customizable to 2014 - 2019) |
|
Quantitative Units |
Revenue in USD Million, Volumes in Units, Pricing in USD |
|
Segments Covered |
Type (Palm Oil, Soybean Oil, Rapeseed Oil, Sunflower Oil, Peanut Oil, Specialty Blended Oil, Olive Oil, Corn Oil, Flaxseed Oil, Avocado Oil, Walnut Oil, Pumpkin Seed Oil, Grapeseed Oil, Others), Package Type (Tinplate Containers, HDPE (High Density Polyethylene) Containers, PVC (Poly Vinyl Chloride) Bottles, PET (Polyethylene Terephthalate) Bottles, Glass Bottles, Semi – Rigid Containers, Flexible Plastic Pouches, Others), Distribution Channel (Direct, Indirect), End User (Domestics, Industrial, Food Service, Others) |
|
Countries Covered |
UAE, Saudi Arabia, Oman, Qatar, Kuwait, South Africa, Rest of Middle East and Africa (MEA) as a part of Middle East and Africa (MEA) |
|
Market Players Covered |
Bunge Limited (US), ADM (US), Cargill, Incorporated (US), ACH Food Companies, Inc. (US), Adani Group (India), SALAD OILS INTERNATIONAL CORPORATION (US), American Vegetable Oils, Inc. (US), BORGES INTERNATIONAL GROUP, S.L. (Spain), Hebany Group (UAE), NGO CHEW HONG EDIBLE OIL PTE LTD (Singapore), TITAN OILS Inc., (Canada) Ragasa - Derechos Reservados (Mexico), SOVENA (Thailand), and Sunora Foods (Canada), among others |
|
Market Opportunities |
|
Middle East and Africa Edible Oil Market Dynamics
This section deals with understanding the market drivers, advantages, opportunities, restraints and challenges. All of this is discussed in detail as below:
Drivers
- Inclination towards Healthy Lifestyle
The increase in the consumer preference for dietary improvements acts as one of the major factors driving the growth of edible oil market. The rise in trend of leading a healthy lifestyle among all age groups shifting to healthy and innovative approach have a positive impact on the industry.
- Prevalence of Obesity
The increase in the prevalence of obesity among population further influences the market. People reaching out to dieticians and nutritionists providing customized diet plans with the aim of losing weight helps in the market growth.
- Awareness Regarding Healthy Lifestyle
The rise in the awareness regarding the importance of leading a healthy lifestyle, accelerate the market growth. The prevalence of various chronic diseases, such as diabetes, and cardiovascular diseases, among others is encouraging people to adopt edible oil.
- Increase in Demand for Functional Foods
The increase in the functional food products further influence the market growth. Also, increase in consumers seeking healthy and sustainable food options along with growing number of sports and gym enthusiasts assist in the expansion of the market.
Additionally, change in lifestyle, increase in the disposable income and rise in awareness regarding the benefits of the nutrition plan positively affect the edible oil market.
Opportunities
Furthermore, rise in demand for clean edible oil products extend profitable opportunities to the market players in the forecast period of 2022 to 2029. Also, research and development activities will further expand the market.
Restraints/Challenges
On the other hand, high cost associated with the products and limited availability of raw materials are expected to obstruct market growth. Also, use of artificial/synthetic ingredients in various applications resulting in health hazards and lack of consistency in regulations are projected to challenge the edible oil market in the forecast period of 2022-2029.
This edible oil market report provides details of new recent developments, trade regulations, import-export analysis, production analysis, value chain optimization, market share, impact of domestic and localized market players, analyses opportunities in terms of emerging revenue pockets, changes in market regulations, strategic market growth analysis, market size, category market growths, application niches and dominance, product approvals, product launches, geographic expansions, technological innovations in the market. To gain more info on edible oil market contact Data Bridge Market Research for an Analyst Brief, our team will help you take an informed market decision to achieve market growth.
COVID-19 Impact on Middle East and Africa Edible Oil Market
COVID-19 had a negative impact on several industries. However, edible oil market witnessed a significant growth during this period. During the lockdown imposed by the government for restricting the spread of the coronavirus disease, most of the population took keen interest in adopting health diets. People are adopting health supplements to increase their immunity with the increasing health complications. The rise in the emphasis on good health is going to keep increasing the growth of the market in the post pandemic scenario.
Middle East and Africa Edible Oil Market Scope and Market Size
The edible oil market is segmented on the basis of type, package type, distribution channel and end user. The growth amongst these segments will help you analyze meager growth segments in the industries and provide the users with a valuable market overview and market insights to help them make strategic decisions for identifying core market applications.
Type
- Palm Oil
- Soybean Oil
- Rapeseed Oil
- Sunflower Oil
- Peanut Oil
- Specialty Blended Oil
- Olive Oil
- Corn Oil
- Flaxseed Oil
- Avocado Oil
- Walnut Oil
- Pumpkin Seed Oil
- Grapeseed Oil
- Others
Package Type
- Tinplate Containers
- HDPE (High Density Polyethylene) Containers
- PVC (Poly Vinyl Chloride) Bottles
- PET (Polyethylene Terephthalate) Bottles
- Glass Bottles, Semi – Rigid Containers
- Flexible Plastic Pouches
- Others
Distribution Channel
- Direct
- Indirect
End User
- Domestics
- Industrial
- Food Services
- Others
Middle East and Africa Edible Oil Market Regional Analysis/Insights
The edible oil market is analysed and market size insights and trends are provided by country, type, package type, distribution channel and end user as referenced above.
The countries covered in the edible oil market report are UAE, Saudi Arabia, Oman, Qatar, Kuwait, South Africa, Rest of Middle East and Africa (MEA) as a part of Middle East and Africa (MEA).
Middle East and Africa region is growing with the highest CAGR due to the emerging opportunities in South Africa for wellbeing and animal nutrition and higher production and consumption of processed food due to the consumer’s preference have boosted the market in Middle East and Africa region.
The country section of the report also provides individual market impacting factors and changes in regulation in the market domestically that impacts the current and future trends of the market. Data points like down-stream and upstream value chain analysis, technical trends and porter's five forces analysis, case studies are some of the pointers used to forecast the market scenario for individual countries. Also, the presence and availability of global brands and their challenges faced due to large or scarce competition from local and domestic brands, impact of domestic tariffs and trade routes are considered while providing forecast analysis of the country data.
Competitive Landscape and Middle East and Africa Edible Oil Market Share Analysis
The edible oil market competitive landscape provides details by competitor. Details included are company overview, company financials, revenue generated, market potential, investment in research and development, new market initiatives, global presence, production sites and facilities, production capacities, company strengths and weaknesses, product launch, product width and breadth, application dominance. The above data points provided are only related to the companies' focus related to edible oil market.
Some of the major players operating in the edible oil market are
- Bunge Limited (US)
- ADM (US)
- Cargill, Incorporated (US)
- ACH Food Companies, Inc. (US)
- Adani Group (India)
- SALAD OILS INTERNATIONAL CORPORATION (US)
- American Vegetable Oils, Inc. (US)
- BORGES INTERNATIONAL GROUP, S.L. (Spain)
- Hebany Group (UAE)
- NGO CHEW HONG EDIBLE OIL PTE LTD (Singapore)
- TITAN OILS Inc., (Canada
- Ragasa - Derechos Reservados (Mexico)
- SOVENA (Thailand)
- Sunora Foods (Canada)
SKU-

- Interactive Data Analysis Dashboard
- Company Analysis Dashboard for high growth potential opportunities
- Research Analyst Access for customization & queries
- Competitor Analysis with Interactive dashboard
- Latest News, Updates & Trend analysis
- Harness the Power of Benchmark Analysis for Comprehensive Competitor Tracking
Table of Content
1 INTRODUCTION
1.1 OBJECTIVES OF THE STUDY
1.2 MARKET DEFINITION
1.3 OVERVIEW OF MIDDLE EAST AND AFRICA EDIBLE OIL MARKET
1.4 LIMITATIONS
1.5 MARKETS COVERED
2 MARKET SEGMENTATION
2.1 MARKETS COVERED
2.2 GEOGRAPHICAL SCOPE
2.3 YEARS CONSIDERED FOR THE STUDY
2.4 CURRENCY AND PRICING
2.5 DBMR TRIPOD DATA VALIDATION MODEL
2.6 MULTIVARIATE MODELLING
2.7 TYPE LIFELINE CURVE
2.8 PRIMARY INTERVIEWS WITH KEY OPINION LEADERS
2.9 DBMR MARKET POSITION GRID
2.1 VENDOR SHARE ANALYSIS
2.11 SECONDARY SOURCES
2.12 ASSUMPTIONS
3 EXECUTIVE SUMMARY
4 PREMIUM INSIGHTS
5 MIDDLE EAST AND AFRICA EDIBLE OIL MARKET: LIST OF SUBSTITUTES
6 MIDDLE EAST AND AFRICA EDIBLE OIL MARKET: MARKETING STRATEGIES
7 MIDDLE EAST AND AFRICA EDIBLE OIL MARKET: REGULATORY FRAMEWORK
7.1 LABELLING REQUIREMENTS (NORTH AMERICA)
7.2 LABELLING REQUIREMENTS (EUROPEAN UNION)
7.3 DOSAGE RECOMMENDATIONS IN DIFFERENT PET ANIMALS
7.4 EDIBLE OILS CERTIFICATIONS
7.4.1 ORGANIC:
7.4.2 AGMARK CERTIFICATION
7.4.3 PLANT AND PLANT PRODUCTS
8 MARKET OVERVIEW
8.1 DRIVERS
8.1.1 EASY AVAILABILITY OF RAW MATERIALS
8.1.2 HEALTH BENEFITS ASSOCIATED WITH EDIBLE OILS
8.1.3 INCREASING DEMAND FOR FORTIFIED EDIBLE OILS
8.1.4 OIL PACKAGING INNOVATIONS
8.1.5 INCREASING DEMAND FOR ORGANIC EDIBLE OIL PRODUCTS
8.2 RESTRAINTS
8.2.1 INTERNATIONAL PRICES OF OILSEEDS AND VEGETABLE OILS
8.2.2 ADULTERATION IN EDIBLE OILS
8.2.3 OBESITY AND EDIBLE OILS
8.3 OPPORTUNITIES
8.3.1 INTRODUCTION OF CLEAN LABELLED EDIBLE OIL PRODUCTS
8.3.2 PREMIUM EDIBLE OIL PRODUCTS
8.3.3 E-COMMERCE CONTINUES TO CREATE OPPORTUNITIES
8.4 CHALLENGES
8.4.1 INCREASING COMPETITION
8.4.2 HEALTH ISSUES ASSOCIATED WITH THE CONSUMPTION OF EDIBLE OILS
9 MIDDLE EAST AND AFRICA EDIBLE OIL MARKET, BY TYPE
9.1 OVERVIEW
9.2 PALM OIL
9.3 OLIVE OIL
9.4 SOYBEAN OIL
9.5 SUNFLOWER OIL
9.6 SPECIALTY BLENDED OIL
9.7 CORN OIL
9.8 RAPESEED OIL
9.9 FLAXSEED OIL
9.1 AVOCADO OIL
9.11 PUMPKIN SEED OIL
9.12 WALNUT OIL
9.13 PEANUT OIL
9.14 GRAPESEED OIL
9.15 OTHER
10 MIDDLE EAST AND AFRICA EDIBLE OIL MARKET, BY PACKAGE TYPE
10.1 OVERVIEW
10.2 TIN PLATE CONTAINERS
10.3 GLASS BOTTLES
10.4 SEMI - RIGID CONTAINERS
10.5 HDPP (HIGH DENSITY POLYETHYLENE CONTAINERS) CONTAINERS
10.6 PET (POLYETHYLENE PTERAPTHALATE) BOTTLES
10.7 PVC (POLY VINYL CHLORIDE) BOTTLES
10.8 FLEXIBLE PLASTIC POUCHES
10.9 OTHERS
11 MIDDLE EAST AND AFRICA EDIBLE OIL MARKET, BY DISTRIBUTION CHANNEL
11.1 OVERVIEW
11.2 DIRECT
11.3 INDIRECT
11.3.1 GROCERY STORE
11.3.2 SUPERMARKETS/HYPERMARKETS
11.3.3 CONVENIENCE STORES
11.3.4 SPECIALTY STORES
11.3.5 E-COMMERCE
11.3.6 OTHERS
12 MIDDLE EAST AND AFRICA EDIBLE OIL MARKET, BY END USER
12.1 OVERVIEW
12.2 DOMESTIC
12.3 FOOD SERVICE
12.3.1 RESTAURANTS
12.3.2 CANTEENS
12.3.3 OTHERS
12.4 INDUSTRIAL
12.5 OTHERS
13 MIDDLE EAST AND AFRICA EDIBLE OIL MARKET, BY REGION
13.1 MIDDLE EAST & AFRICA
13.1.1 SOUTH AFRICA
13.1.2 SAUDI ARABIA
13.1.3 U.A.E
13.1.4 OMAN
13.1.5 QATAR
13.1.6 KUWAIT
13.1.7 REST OF MIDDLE EAST & AFRICA
14 MIDDLE EAST AND AFRICA EDIBLE OIL MARKET: COMPANY LANDSCAPE
14.1 COMPANY SHARE ANALYSIS: MIDDLE EAST AND AFRICA
15 SWOT
16 COMPANY PROFILE
16.1 ADANI GROUP
16.1.1 COMPANY SNAPSHOT
16.1.2 REVENUE ANALYSIS
16.1.3 VENDOR SHARE ANALYSIS
16.1.4 PRODUCT PORTFOLIO
16.1.5 RECENT DEVELOPMENTS
16.2 BUNGE LIMITED
16.2.1 COMPANY SNAPSHOT
16.2.2 REVENUE ANALYSIS
16.2.3 VENDOR SHARE ANALYSIS
16.2.4 PRODUCT PORTFOLIO
16.2.5 RECENT DEVELOPMENTS
16.3 ADM
16.3.1 COMPANY SNAPSHOT
1.2.1 REVENUE ANALYSIS
16.3.2 VENDOR SHARE ANALYSIS
16.3.3 PRODUCT PORTFOLIO
16.3.4 RECENT DEVELOPMENTS
16.4 CARGILL, INCORPORATED.
16.4.1 COMPANY SNAPSHOT
16.4.2 REVENUE ANALYSIS
16.4.3 VENDOR SHARE ANALYSIS
16.4.4 PRODUCT PORTFOLIO
16.4.5 RECENT DEVELOPMENTS
16.5 ACH FOOD COMPANIES, INC.
16.5.1 COMPANY SNAPSHOT
16.5.2 PRODUCT PORTFOLIO
16.5.3 RECENT DEVELOPMENTS
16.6 AJANTA SOYA LIMITED
16.6.1 COMPANY SNAPSHOT
16.6.2 REVENUE ANALYSIS
16.6.3 PRODUCT PORTFOLIO
16.6.4 RECENT DEVELOPMENT
16.7 AMERICAN VEGETABLE OILS, INC.
16.7.1 COMPANY SNAPSHOT
16.7.2 PRODUCT PORTFOLIO
16.7.3 RECENT DEVELOPMENT
16.8 BASSO FEDELE & FIGLI
16.8.1 COMPANY SNAPSHOT
16.8.2 PRODUCT PORTFOLIO
16.8.3 RECENT DEVELOPMENT
16.9 BORGES INTERNATIONAL GROUP, S.L.
16.9.1 COMPANY SNAPSHOT
16.9.2 REVENUE ANALYSIS
16.9.3 PRODUCT PORTFOLIO
16.9.4 RECENT DEVELOPMENT
16.1 EDIBLE OILS LTD
16.10.1 COMPANY SNAPSHOT
16.10.2 PRODUCT PORTFOLIO
16.10.3 RECENT DEVELOPMENT
16.11 HEBANY GROUP
16.11.1 COMPANY SNAPSHOT
16.11.2 PRODUCT PORTFOLIO
16.11.3 RECENT DEVELOPMENT
16.12 HENRY LAMOTTE OILS GMBH
16.12.1 COMPANY SNAPSHOT
16.12.2 PRODUCT PORTFOLIO
16.12.3 RECENT DEVELOPMENT
16.13 NGO CHEW HONG EDIBLE OIL PTE LTD’S (A SUBSIDIARY OF MEWAH GROUP)
16.13.1 COMPANY SNAPSHOT
1.8.1 REVENUE ANALYSIS
16.13.2 PRODUCT PORTFOLIO
16.13.3 RECENT DEVELOPMENT
16.14 OLENEX SÀRL
16.14.1 COMPANY SNAPSHOT
16.14.2 PRODUCT PORTFOLIO
16.14.3 RECENT DEVELOPMENT
16.15 OLYMPIC OILS LTD.
16.15.1 COMPANY SNAPSHOT
16.15.2 PRODUCT PORTFOLIO
16.15.3 RECENT DEVELOPMENT
16.16 RAGASA - DERECHOS RESERVADOS
16.16.1 COMPANY SNAPSHOT
16.16.2 PRODUCT PORTFOLIO
16.16.3 RECENT DEVELOPMENT
16.17 RUCHI SOYA INDUSTRIES LTD
16.17.1 COMPANY SNAPSHOT
16.17.2 PRODUCT PORTFOLIO
16.17.3 RECENT DEVELOPMENT
16.18 SALAD OILS INTERNATIONAL CORPORATION
16.18.1 COMPANY SNAPSHOT
16.18.2 PRODUCT PORTFOLIO
16.18.3 RECENT DEVELOPMENT
16.19 SOVENA
16.19.1 COMPANY SNAPSHOT
16.19.2 PRODUCT PORTFOLIO
16.19.3 RECENT DEVELOPMENTS
16.2 ,SUNORA FOODS
16.20.1 COMPANY SNAPSHOT
16.20.2 REVENUE ANALYSIS
16.20.3 PRODUCT PORTFOLIO
16.20.4 RECENT DEVELOPMENTS
16.21 TITAN OILS INC.
16.21.1 COMPANY SNAPSHOT
16.21.2 PRODUCT PORTFOLIO
16.21.3 RECENT DEVELOPMENT
16.22 VALTRIS SPECIALTY CHEMICALS
16.22.1 COMPANY SNAPSHOT
16.22.2 PRODUCT PORTFOLIO
16.22.3 RECENT DEVELOPMENTS
17 QUESTIONNAIRE
18 RELATED REPORTS
List of Table
LIST OF TABLES
TABLE 1 APPROXIMATE FAT CONTENT OF MAJOR EDIBLE OILS
TABLE 2 MIDDLE EAST AND AFRICA EDIBLE OIL MARKET, BY TYPE, 2018-2027 (USD MILLION)
TABLE 3 MIDDLE EAST AND AFRICA PALM OIL IN EDIBLE OIL MARKET, BY REGION, 2018-2027 (USD MILLION)
TABLE 4 MIDDLE EAST AND AFRICA OLIVE OIL IN EDIBLE OIL MARKET, BY REGION, 2018-2027 (USD MILLION)
TABLE 5 MIDDLE EAST AND AFRICA SOYBEAN OIL IN EDIBLE OIL MARKET, BY REGION, 2018-2027 (USD MILLION)
TABLE 6 MIDDLE EAST AND AFRICA SUNFLOWER OIL IN EDIBLE OIL MARKET, BY REGION, 2018-2027 (USD MILLION)
TABLE 7 MIDDLE EAST AND AFRICA SPECIALTY BLENDED IN EDIBLE OIL MARKET, BY REGION, 2018-2027 (USD MILLION)
TABLE 8 MIDDLE EAST AND AFRICA CORN OIL IN EDIBLE OIL MARKET, BY REGION, 2018-2027 (USD MILLION)
TABLE 9 MIDDLE EAST AND AFRICA RAPESEED OIL IN EDIBLE OIL MARKET, BY REGION, 2018-2027 (USD MILLION)
TABLE 10 MIDDLE EAST AND AFRICA FLAXSEED OIL IN EDIBLE OIL MARKET, BY REGION, 2018-2027 (USD MILLION)
TABLE 11 MIDDLE EAST AND AFRICA AVOCADO OIL IN EDIBLE OIL MARKET, BY REGION, 2018-2027 (USD MILLION)
TABLE 12 MIDDLE EAST AND AFRICA PUMPKIN SEED OIL IN EDIBLE OIL MARKET, BY REGION, 2018-2027 (USD MILLION)
TABLE 13 MIDDLE EAST AND AFRICA WALNUT OIL IN EDIBLE OIL MARKET, BY REGION, 2018-2027 (USD MILLION)
TABLE 14 MIDDLE EAST AND AFRICA PEANUT OIL IN EDIBLE OIL MARKET, BY REGION, 2018-2027 (USD MILLION)
TABLE 15 MIDDLE EAST AND AFRICA GRAPESEED OIL IN EDIBLE OIL MARKET, BY REGION, 2018-2027 (USD MILLION)
TABLE 16 MIDDLE EAST AND AFRICA OTHERS IN EDIBLE OIL MARKET, BY REGION, 2018-2027 (USD MILLION)
TABLE 17 MIDDLE EAST AND AFRICA EDIBLE OIL MARKET,BY PACKAGE TYPE, 2018-2027 (USD MILLION)
TABLE 18 MIDDLE EAST AND AFRICA TIN PLATE CONTAINERS IN EDIBLE OIL MARKET, BY REGION, 2018-2027 (USD MILLION )
TABLE 19 MIDDLE EAST AND AFRICA GLASS BOTTLES IN EDIBLE OIL MARKET, BY REGION, 2018-2027 (USD MILLION )
TABLE 20 MIDDLE EAST AND AFRICA SEMI RIGID CONTAINERS IN EDIBLE OIL MARKET, BY REGION, 2018-2027 (USD MILLION )
TABLE 21 MIDDLE EAST AND AFRICA HDPE ( HIGH DENSITY POLYETHYLENE) CONTAINERS IN EDIBLE OIL MARKET, BY REGION, 2018-2027 (USD MILLION )
TABLE 22 MIDDLE EAST AND AFRICA PET(POLYETHYLENE TEREPHTHALATE)BOTTLES IN EDIBLE OIL MARKET, BY REGION, 2018-2027 (USD MILLION )
TABLE 23 MIDDLE EAST AND AFRICA PVC ( POLYVINYL CHLORIDE) IN EDIBLE OIL MARKET, BY REGION, 2018-2027 (USD MILLION )
TABLE 24 MIDDLE EAST AND AFRICA FLEXIBLE PLASTIC POUCHES IN EDIBLE OIL MARKET, BY REGION, 2018-2027 (USD MILLION )
TABLE 25 MIDDLE EAST AND AFRICA OTHERS IN EDIBLE OIL MARKET, BY REGION, 2018-2027 (USD MILLION )
TABLE 26 MIDDLE EAST AND AFRICA EDIBLE OIL MARKET, BY DISTRIBUTION CHANNEL, 2018-2027 (USD MILLION)
TABLE 27 MIDDLE EAST AND AFRICA DIRECT IN EDIBLE OIL MARKET, BY REGION, 2018-2027 (USD MILLION)
TABLE 28 MIDDLE EAST AND AFRICA INDIRECT IN EDIBLE OIL MARKET, BY REGION, 2018-2027 (USD MILLION)
TABLE 29 MIDDLE EAST AND AFRICA INDIRECT IN EDIBLE OIL MARKET, BY DISTRIBUTION CHANNEL, 2018-2027 (USD MILLION)
TABLE 30 MIDDLE EAST AND AFRICA EDIBLE OIL MARKET, BY END USER, 2018– 2027 (USD MILLION )
TABLE 31 MIDDLE EAST AND AFRICA PRODUCTION OF EDIBLE OIL 2018-19
TABLE 32 MIDDLE EAST AND AFRICA DOMESTIC IN EDIBLE OIL MARKET, BY REGION, 2018-2027 (USD MILLION )
TABLE 33 MIDDLE EAST AND AFRICA FOOD SERVICES IN EDIBLE OIL SMARKET, BY REGION, 2018-2027 (USD MILLION )
TABLE 34 MIDDLE EAST AND AFRICA FOOD SERVICE IN EDIBLE OIL MARKET,BY END USER, 2018-2027 (USD MILLION)
TABLE 35 MIDDLE EAST AND AFRICA INDUSTRIAL IN EDIBLE OIL MARKET, BY REGION, 2018-2027 (USD MILLION )
TABLE 36 MIDDLE EAST AND AFRICA OTHERS IN EDIBLE OIL MARKET, BY REGION, 2018-2027 (USD MILLION )
TABLE 37 MIDDLE EAST AND AFRICA EDIBLE OIL MARKET, BY COUNTRY, 2018-2027 (USD MILLION)
TABLE 38 MIDDLE EAST AND AFRICA EDIBLE OIL MARKET, BY TYPE, 2018-2027 (USD MILLION)
TABLE 39 MIDDLE EAST & AFRICA EDIBLE OIL MARKET, BY PACKAGE TYPE, 2018-2027 (USD MILLION)
TABLE 40 MIDDLE EAST & AFRICA EDIBLE OIL MARKET, BY DISTRIBUTION CHANNEL, 2018-2027 (USD MILLION)
TABLE 41 MIDDLE EAST & AFRICA INDIRECT IN EDIBLE OIL MARKET, BY DISTRIBUTION CHANNEL, 2018-2027 (USD MILLION)
TABLE 42 MIDDLE EAST & AFRICA EDIBLE OIL MARKET, BY END USER, 2018-2027 (USD MILLION)
TABLE 43 MIDDLE EAST & AFRICA FOOD SERVICE IN EDIBLE OIL MARKET, BY END USER, 2018-2027 (USD MILLION)
TABLE 44 SOUTH AFRICA EDIBLE OIL MARKET, BY TYPE, 2018-2027 (USD MILLION)
TABLE 45 SOUTH AFRICA EDIBLE OIL MARKET, BY PACKAGE TYPE, 2018-2027 (USD MILLION)
TABLE 46 SOUTH AFRICA EDIBLE OIL MARKET, BY DISTRIBUTION CHANNEL, 2018-2027 (USD MILLION)
TABLE 47 SOUTH AFRICA INDIRECT IN EDIBLE OIL MARKET, BY DISTRIBUTION CHANNEL, 2018-2027 (USD MILLION)
TABLE 48 SOUTH AFRICA EDIBLE OIL MARKET, BY END USER, 2018-2027 (USD MILLION)
TABLE 49 SOUTH AFRICA FOOD SERVICE IN EDIBLE OIL MARKET, BY END USER, 2018-2027 (USD MILLION)
TABLE 50 SAUDI ARABIA EDIBLE OIL MARKET, BY TYPE, 2018-2027 (USD MILLION)
TABLE 51 SAUDI ARABIA EDIBLE OIL MARKET, BY PACKAGE TYPE, 2018-2027 (USD MILLION)
TABLE 52 SAUDI ARABIA EDIBLE OIL MARKET, BY DISTRIBUTION CHANNEL, 2018-2027 (USD MILLION)
TABLE 53 SAUDI ARABIA INDIRECT IN EDIBLE OIL MARKET, BY DISTRIBUTION CHANNEL, 2018-2027 (USD MILLION)
TABLE 54 SAUDI ARABIA EDIBLE OIL MARKET, BY END USER, 2018-2027 (USD MILLION)
TABLE 55 SAUDI ARABIA FOOD SERVICE IN EDIBLE OIL MARKET, BY END USER, 2018-2027 (USD MILLION)
TABLE 56 U.A.E EDIBLE OIL MARKET, BY TYPE, 2018-2027 (USD MILLION)
TABLE 57 U.A.E EDIBLE OIL MARKET, BY PACKAGE TYPE, 2018-2027 (USD MILLION)
TABLE 58 U.A.E EDIBLE OIL MARKET, BY DISTRIBUTION CHANNEL, 2018-2027 (USD MILLION)
TABLE 59 U.A.E INDIRECT IN EDIBLE OIL MARKET, BY DISTRIBUTION CHANNEL, 2018-2027 (USD MILLION)
TABLE 60 U.A.E EDIBLE OIL MARKET, BY END USER, 2018-2027 (USD MILLION)
TABLE 61 U.A.E FOOD SERVICE IN EDIBLE OIL MARKET, BY END USER, 2018-2027 (USD MILLION)
TABLE 62 OMAN EDIBLE OIL MARKET,BY TYPE, 2018-2027 (USD MILLION)
TABLE 63 OMAN EDIBLE OIL MARKET, BY PACKAGE TYPE, 2018-2027 (USD MILLION)
TABLE 64 OMAN EDIBLE OIL MARKET, BY DISTRIBUTION CHANNEL, 2018-2027 (USD MILLION)
TABLE 65 OMAN INDIRECT IN EDIBLE OIL MARKET, BY DISTRIBUTION CHANNEL, 2018-2027 (USD MILLION)
TABLE 66 OMAN EDIBLE OIL MARKET, BY END USER, 2018-2027 (USD MILLION)
TABLE 67 OMAN FOOD SERVICE IN EDIBLE OIL MARKET, BY END USER, 2018-2027 (USD MILLION)
TABLE 68 QATAR EDIBLE OIL MARKET, BY TYPE, 2018-2027 (USD MILLION)
TABLE 69 QATAR EDIBLE OIL MARKET, BY PACKAGE TYPE, 2018-2027 (USD MILLION)
TABLE 70 QATAR EDIBLE OIL MARKET, BY DISTRIBUTION CHANNEL, 2018-2027 (USD MILLION)
TABLE 71 QATAR INDIRECT IN EDIBLE OIL MARKET, BY DISTRIBUTION CHANNEL, 2018-2027 (USD MILLION)
TABLE 72 QATAR EDIBLE OIL MARKET, BY END USER, 2018-2027 (USD MILLION)
TABLE 73 QATAR FOOD SERVICE IN EDIBLE OIL MARKET, BY END USER, 2018-2027 (USD MILLION)
TABLE 74 KUWAIT EDIBLE OIL MARKET, BY TYPE, 2018-2027 (USD MILLION)
TABLE 75 KUWAIT EDIBLE OIL MARKET,BY PACKAGE TYPE, 2018-2027 (USD MILLION)
TABLE 76 KUWAIT EDIBLE OIL MARKET, BY DISTRIBUTION CHANNEL, 2018-2027 (USD MILLION)
TABLE 77 KUWAIT INDIRECT IN EDIBLE OIL MARKET, BY DISTRIBUTION CHANNEL, 2018-2027 (USD MILLION)
TABLE 78 KUWAIT EDIBLE OIL MARKET, BY END USER, 2018-2027 (USD MILLION)
TABLE 79 KUWAIT FOOD SERVICE IN EDIBLE OIL MARKET, BY END USER, 2018-2027 (USD MILLION)
TABLE 80 REST OF MIDDLE EAST & AFRICA EDIBLE OIL MARKET, BY TYPE, 2018-2027 (USD MILLION)
TABLE 81 REST OF MIDDLE EAST & AFRICA EDIBLE OIL MARKET, BY PACKAGE TYPE, 2018-2027 (USD MILLION)
TABLE 82 REST OF MIDDLE EAST & AFRICA EDIBLE OIL MARKET, BY DISTRIBUTION CHANNEL, 2018-2027 (USD MILLION)
TABLE 83 REST OF MIDDLE EAST & AFRICA INDIRECT IN EDIBLE OIL MARKET, BY DISTRIBUTION CHANNEL, 2018-2027 (USD MILLION)
TABLE 84 REST OF MIDDLE EAST & AFRICA EDIBLE OIL MARKET, BY END USER, 2018-2027 (USD MILLION)
TABLE 85 REST OF MIDDLE EAST & AFRICA FOOD SERVICE IN EDIBLE OIL MARKET, BY END USER, 2018-2027 (USD MILLION)
List of Figure
LIST OF FIGURES
FIGURE 1 MIDDLE EAST AND AFRICA EDIBLE OIL MARKET: SEGMENTATION
FIGURE 2 MIDDLE EAST AND AFRICA EDIBLE OIL MARKET: DATA TRIANGULATION
FIGURE 3 MIDDLE EAST AND AFRICA EDIBLE OIL MARKET: DROC ANALYSIS
FIGURE 4 MIDDLE EAST AND AFRICA EDIBLE OIL MARKET: MIDDLE EAST AND AFRICA VS REGIONAL MARKET ANALYSIS
FIGURE 5 MIDDLE EAST AND AFRICA EDIBLE OIL MARKET: COMPANY RESEARCH ANALYSIS
FIGURE 6 MIDDLE EAST AND AFRICA EDIBLE OIL MARKET: INTERVIEW DEMOGRAPHICS
FIGURE 7 MIDDLE EAST AND AFRICA EDIBLE OIL MARKET: DBMR MARKET POSITION GRID
FIGURE 8 MIDDLE EAST AND AFRICA EDIBLE OIL MARKET: VENDOR SHARE ANALYSIS
FIGURE 9 MIDDLE EAST AND AFRICA EDIBLE OIL MARKET: SEGMENTATION
FIGURE 10 EASY AVAILABILITY OF RAW MATERIALS AND DEMAND FOR ORGANIC EDIBLE OILS PRODUCTS ARE DRIVING THE MIDDLE EAST AND AFRICA EDIBLE OIL MARKET IN THE FORECAST PERIOD OF 2020 TO 2027
FIGURE 11 SOYBEAN OIL SEGMENT IS EXPECTED TO ACCOUNT FOR THE LARGEST SHARE OF THE MIDDLE EAST AND AFRICA EDIBLE OIL MARKET IN 2020 & 2027
FIGURE 12 DRIVERS, RESTRAINTS, OPPORTUNITIES AND CHALLENGES OF MIDDLE EAST AND AFRICA EDIBLE OIL MARKET
FIGURE 13 AVERAGE PRODUCTION OF OILSEEDS (EXCLUDING SOYBEAN) IN 2015 TO 2017
FIGURE 14 ORGANIC RETAIL SALES, IN 2018
FIGURE 15 INTERNATIONAL PRICES OF VEGETABLE OILS
FIGURE 16 E-COMMERCE SALES: TOP TEN ECONOMIES, IN 2018
FIGURE 17 ASIA-PACIFIC IS THE FASTEST GROWING MARKET FOR EDIBLE OIL MANUFACTURERS IN THE FORECAST PERIOD OF 2020 TO 2027
FIGURE 18 MIDDLE EAST AND AFRICA EDIBLE OIL MARKET, BY TYPE, 2019
FIGURE 1 MIDDLE EAST AND AFRICA EDIBLE OIL MARKET, BY PACKAGE TYPE, 2019
FIGURE 2 MIDDLE EAST AND AFRICA EDIBLE OIL MARKET, BY DISTRIBUTION CHANNEL, 2019
FIGURE 3 MIDDLE EAST AND AFRICA EDIBLE OIL MARKET, BY END USER, 2019
FIGURE 4 MIDDILE EAST & AFRICA SUNFLOWER SEED MARKET: SNAPSHOT (2019)
FIGURE 5 MIDDLE EAST & AFRICA SUNFLOWER SEEDSMARKET: BY COUNTRY (2019)
FIGURE 6 MIDDLE EAST & AFRICA SUNFLOWER SEEDSMARKET: BY COUNTRY (2020&2027)
FIGURE 7 MIDDLE EAST & AFRICA SUNFLOWER SEEDSMARKET: BY COUNTRY (2019&2027)
FIGURE 8 MIDDLE EAST & AFRICA SUNFLOWER SEEDSMARKET: BY CATEGORY (2020&2027)
FIGURE 9 MIDDLE EAST AND AFRICA EDIBLE OIL MARKET: COMPANY SHARE 2019 (%)
Middle East And Africa Edible Oils Market, Supply Chain Analysis and Ecosystem Framework
To support market growth and help clients navigate the impact of geopolitical shifts, DBMR has integrated in-depth supply chain analysis into its Middle East And Africa Edible Oils Market research reports. This addition empowers clients to respond effectively to global changes affecting their industries. The supply chain analysis section includes detailed insights such as Middle East And Africa Edible Oils Market consumption and production by country, price trend analysis, the impact of tariffs and geopolitical developments, and import and export trends by country and HSN code. It also highlights major suppliers with data on production capacity and company profiles, as well as key importers and exporters. In addition to research, DBMR offers specialized supply chain consulting services backed by over a decade of experience, providing solutions like supplier discovery, supplier risk assessment, price trend analysis, impact evaluation of inflation and trade route changes, and comprehensive market trend analysis.
Data collection and base year analysis are done using data collection modules with large sample sizes. The stage includes obtaining market information or related data through various sources and strategies. It includes examining and planning all the data acquired from the past in advance. It likewise envelops the examination of information inconsistencies seen across different information sources. The market data is analysed and estimated using market statistical and coherent models. Also, market share analysis and key trend analysis are the major success factors in the market report. To know more, please request an analyst call or drop down your inquiry.
The key research methodology used by DBMR research team is data triangulation which involves data mining, analysis of the impact of data variables on the market and primary (industry expert) validation. Data models include Vendor Positioning Grid, Market Time Line Analysis, Market Overview and Guide, Company Positioning Grid, Patent Analysis, Pricing Analysis, Company Market Share Analysis, Standards of Measurement, Global versus Regional and Vendor Share Analysis. To know more about the research methodology, drop in an inquiry to speak to our industry experts.
Data Bridge Market Research is a leader in advanced formative research. We take pride in servicing our existing and new customers with data and analysis that match and suits their goal. The report can be customized to include price trend analysis of target brands understanding the market for additional countries (ask for the list of countries), clinical trial results data, literature review, refurbished market and product base analysis. Market analysis of target competitors can be analyzed from technology-based analysis to market portfolio strategies. We can add as many competitors that you require data about in the format and data style you are looking for. Our team of analysts can also provide you data in crude raw excel files pivot tables (Fact book) or can assist you in creating presentations from the data sets available in the report.


