
Market Analysis and Insights : Middle East and Africa Wearable Conferencing Technology Market
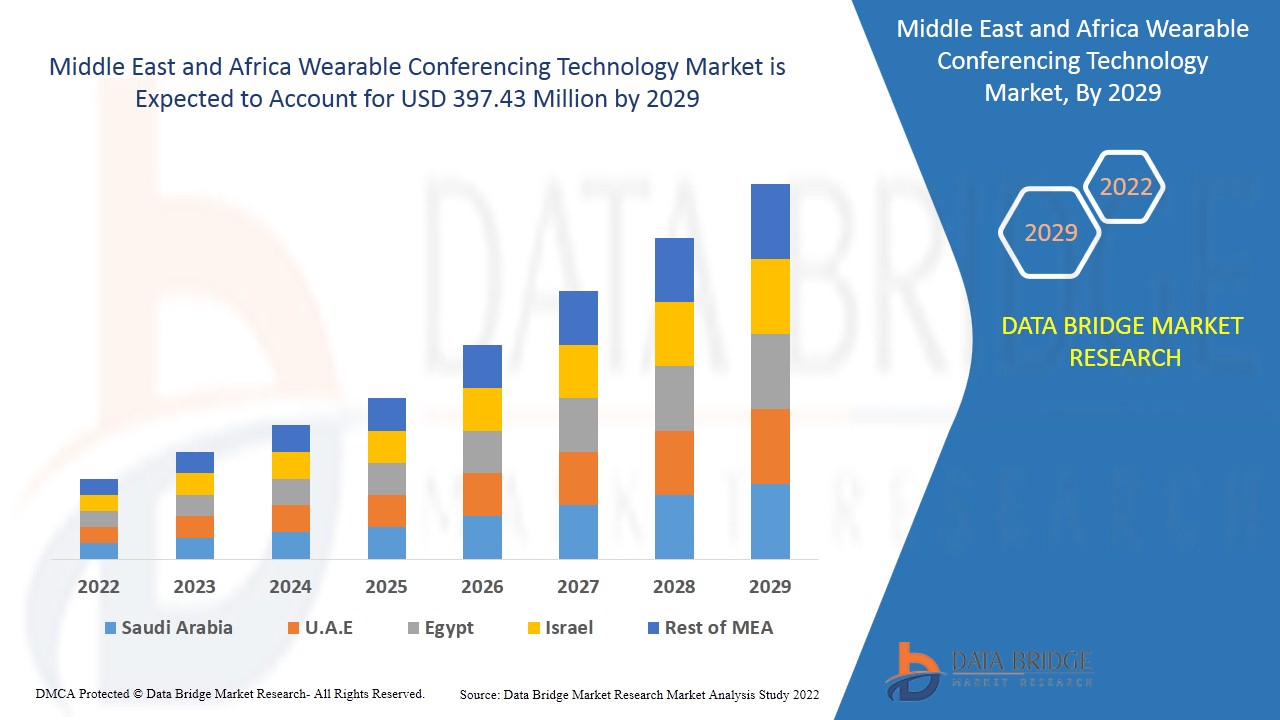
Middle East and Africa wearable conferencing technology market is expected to gain market growth in the forecast period of 2022 to 2029. Data Bridge Market Research analyses that the market is growing with a CAGR of 12.1% in the forecast period of 2022 to 2029 and is expected to reach USD 397.43 million by 2029. Surging focus and adoption of remote working culture is boosting the Middle East and Africa wearable conferencing technology market.
Wearable technology, often known as "wearables," is a class of electronic devices that can be worn on the body. The gadgets are hands-free devices with practical applications that are powered by microprocessors and have the ability to send and receive data via the Internet. Real-time cooperation between several devices is possible with conferencing solutions. Participants can join a single digital place using their mobile devices, laptops, or personal computers (PCs) using a conferencing platform. Users can use an Internet connection to access conferencing technologies that are supplied as software as a service (SaaS). A web conferencing platform can also be supplied on-premises, utilizing an organization's data center capabilities. Thus, it is a technology, which is used in the devices such as Google Glasses or Microsoft HoloLens for the application of conferencing and collaborating via audio or video medium. Currently this market has wide applications in the corporate world for professional collaborations and in educational and training sectors.
The surging focus and adoption of remote working culture acts as a driver in the Middle East and Africa wearable conferencing technology market. The intermittent nature of wind energy prove to be a challenge. However, increase in various strategic decisions such as partnerships are expected to provide opportunities for the Middle East and Africa wearable conferencing technology market. The high cost of conferencing infrastructure can prove to be a restrain for the market.
The Middle East and Africa wearable conferencing technology market report provides details of market share, new developments, and product pipeline analysis, the impact of domestic and localized market players, analyses opportunities in terms of emerging revenue pockets, changes in market regulations, product approvals, strategic decisions, product launches, geographic expansions, and technological innovations in the market. To understand the analysis and the Middle East and Africa Wearable conferencing technology market scenario, contact Data Bridge Market Research for an Analyst Brief; our team will help you create a revenue impact solution to achieve your desired goal.
Middle East and Africa Wearable Conferencing Technology Market Scope and Market Size
The Middle East and Africa wearable conferencing technology market is segmented based on offering, conferencing type, deployment mode, organization size, application and end use. The growth among segments helps you analyze niche pockets of growth and strategies to approach the market and determine your core application areas and the difference in your target markets.
- Based on offering, the Middle East and Africa wearable conferencing technology market is segmented into hardware, software and services. Hardware is further sub-segmented into camera, microphone and others. In addition, services is further sub-segmented into managed services and professional services. In 2022, hardware is expected to dominate the Middle East and Africa wearable conferencing technology market as it offers the features like live streaming and can be easily connected to different devices for easy collaborations.
- Based on conferencing type, the Middle East and Africa wearable conferencing technology market is segmented into audio conferencing and video conferencing. In 2022, the video conferencing segment is expected to dominate as it facilitates virtual meetings and collaboration on digital documents and shared presentations by connecting individuals in real time video communication.
- Based on deployment mode, the Middle East and Africa wearable conferencing technology market is segmented into on-premise and cloud. In 2022, on-premise segment is anticipated to dominate the market as it help to provide security and privacy of the infrastructure in the business. The investment in this deployment is comparatively low.
- Based on organization size, the Middle East and Africa wearable conferencing technology market is segmented into small & medium organization and large organization. In 2022, large organization segment is anticipated to dominate the market as the solution help the company to move more efficiently towards it productivity goals.
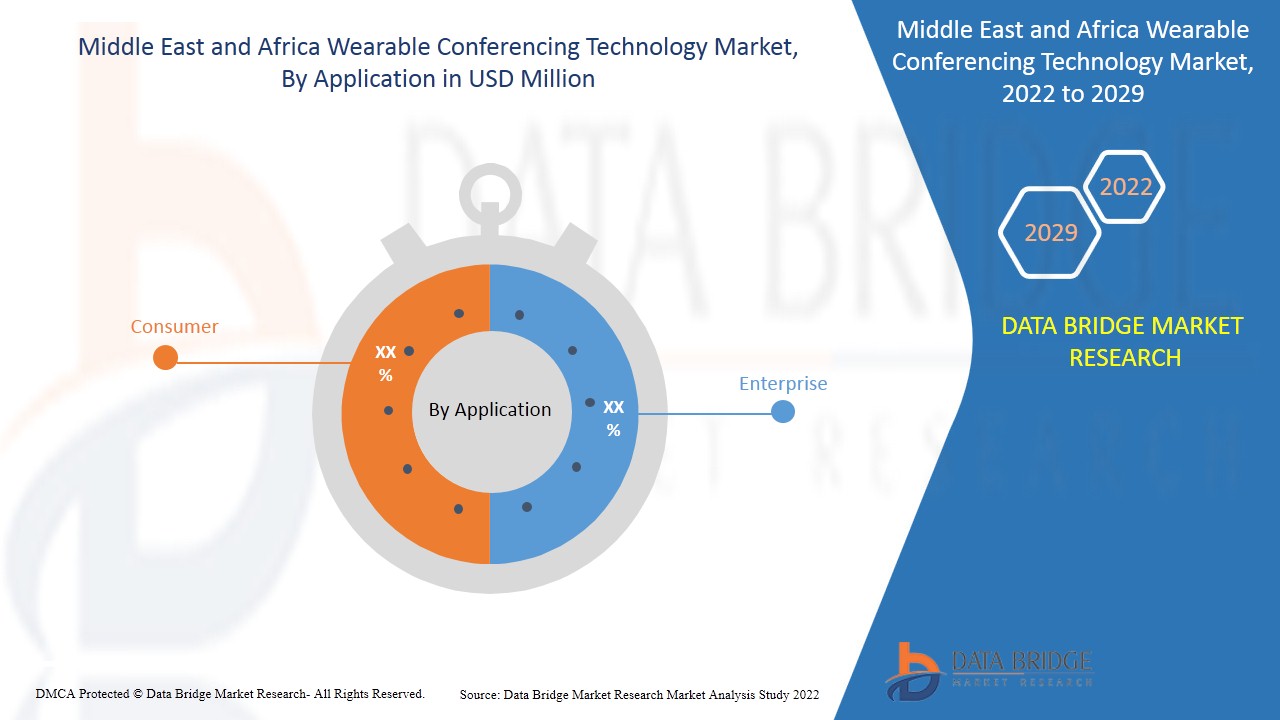
- Based on application, the Middle East and Africa wearable conferencing technology market is segmented into consumer and enterprise. In 2022, enterprise segment is anticipated to dominate the market as it the solution help the employees to working remotely with ease and completed their enterprise operation goals.
- Based on end use, the Middle East and Africa wearable conferencing technology market is segmented into corporate, education, healthcare, government and defense, banking, financial services and insurance (BSFI), media and entertainment and other. In 2022, corporate segment is anticipated to dominate the market as conferencing solutions help the employees to collaborate and work on projects with the technology increases productivity and saves time.
Middle East and Africa Wearable Conferencing Technology Market Country Level Analysis
The Middle East and Africa Wearable conferencing technology market is analyzed, and market size offering, conferencing type, deployment mode, organization size, application and end use as referenced above.
The countries covered in the Middle East and Africa Wearable conferencing technology market report are South Africa, Saudi Arabia, Israel, U.A.E., Egypt and Rest of Middle East and Africa. South Africa dominates the Middle East and Africa Wearable conferencing technology market due to the high manufacturing facilities of larger corporates. Saudi Arabia holds the second place with the high infrastructural development in the region and IT industry the demand is increasing for this technology. Israel holds the third place due to the developed manufacturing sector and research facilities of large corporations such as Intel and Microsoft.
The country section of the report also provides individual market impacting factors and changes in regulation in the market domestically that impact the current and future trends of the market. Data points such as new sales, replacement sales, country demographics, regulatory acts, and import-export tariffs are some of the major pointers used to forecast the market scenario for individual countries. Also, the presence and availability of Middle East and Africa brands and their challenges faced due to large or scarce competition from local and domestic brands, the impact of sales channels are considered while providing forecast analysis of the country data.
Increasing penetration of smart devices and internet services is boosting the market growth of Middle East and Africa wearable conferencing technology market
The Middle East and Africa Wearable conferencing technology market also provides you with a detailed market analysis for every country's growth in a particular market. Additionally, it provides detailed information regarding the market players’ strategy and their geographical presence. The data is available for the historical period 2011 to 2020.
Competitive Landscape and Middle East and Africa Wearable Conferencing Technology Market Share Analysis
The Middle East and Africa wearable conferencing technology market competitive landscape provides details by the competitor. Details included are company overview, company financials, revenue generated, market potential, investment in research and development, new market initiatives, production sites and facilities, company strengths and weaknesses, product launch, product trials pipelines, product approvals, patents, product width, and breadth, application dominance, technology lifeline curve. The above data points provided are only related to the company’s focus related to the Middle East and Africa wearable conferencing technology market.
The major companies which are dealing in the Middle East and Africa wearable conferencing technology are Logitech, Vuzix Corporation, Vidyo, Inc., Ricoh, Zoom Video Communications, Inc., Microsoft, LogMeIn, Inc., RealWear, Inc., DIALPAD, INC., Google (a subsidiary of Alphabet Inc.), Chironix, Seiko Epson Corporation, Iristick, Robert Bosch GmbH, ezTalks, HTC Corporation, Sony Corporation, Lenovo, EON Reality, TeamViewer among others in domestic players. DBMR analysts understand competitive strengths and provide competitive analysis for each competitor separately.
Many contracts and agreements are also initiated by the companies worldwide, which accelerates the Middle East and Africa wearable conferencing technology market.
For instances,
- In October 2021, LogMeIn, Inc. has released GoToConnect Legal, a new version of its unified communications as a service (UCaaS) platform. The platform is designed to meet the demands of legal professionals by facilitating collaboration with clients and colleagues in order to maximize billable hours. The solution will allow minimizing unbilled time, maximizing revenue, managing regulations from governing bodies, and maintaining high security in their practice. Thus, the company will help to deliver high quality and easily billable services to their clients.
- In December 2021, Vidyo, Inc. unveiled new VidyoRoom Solutions interfaces, including three new in-office video conferencing experiences tailored to deliver the best collaboration environment for hybrid teams. New interfaces for huddle rooms, meeting rooms, and boardrooms, including conference controls and support for immersive experiences, will become increasingly vital as employees try to return to the office following the pandemic, while others continue to work remotely. With this company will be able to provide user-friendly experience to its clients.
SKU-

- Interactive Data Analysis Dashboard
- Company Analysis Dashboard for high growth potential opportunities
- Research Analyst Access for customization & queries
- Competitor Analysis with Interactive dashboard
- Latest News, Updates & Trend analysis
- Harness the Power of Benchmark Analysis for Comprehensive Competitor Tracking
Table of Content
1 INTRODUCTION
1.1 OBJECTIVES OF THE STUDY
1.2 MARKET DEFINITION
1.3 OVERVIEW OF MIDDLE EAST AND AFRICA WEARABLE CONFERENCING TECHNOLOGY MARKET
1.4 CURRENCY AND PRICING
1.5 LIMITATIONS
1.6 MARKETS COVERED
2 MARKET SEGMENTATION
2.1 MARKETS COVERED
2.2 GEOGRAPHICAL SCOPE
2.3 YEARS CONSIDERED FOR THE STUDY
2.4 DBMR TRIPOD DATA VALIDATION MODEL
2.5 PRIMARY INTERVIEWS WITH KEY OPINION LEADERS
2.6 DBMR MARKET POSITION GRID
2.7 VENDOR SHARE ANALYSIS
2.8 MULTIVARIATE MODELING
2.9 TYPE TIMELINE CURVE
2.1 MARKET APPLICATION COVERAGE GRID
2.11 SECONDARY SOURCES
2.12 ASSUMPTIONS
3 EXECUTIVE SUMMARY
4 PREMIUM INSIGHTS
5 MARKET OVERVIEW
5.1 DRIVERS
5.1.1 SURGING FOCUS AND ADOPTION OF REMOTE WORKING CULTURE
5.1.2 INCREASING PENETRATION OF SMART DEVICES AND INTERNET SERVICES
5.1.3 RISE IN ADOPTION OF CONFERENCING TECHNOLOGY BY EDUCATIONAL INSTITUTES
5.2 RESTRAINTS
5.2.1 HIGH COST OF CONFERENCING INFRASTRUCTURE
5.2.2 LOSS OF DATA AND PRIVACY
5.3 OPPORTUNITIES
5.3.1 INCREASE IN VARIOUS STRATEGIC DECISIONS SUCH AS PARTNERSHIP AND ACQUISITION
5.3.2 RISE IN INITIATIVES BY GOVERNMENT
5.4 CHALLENGES
5.4.1 MIDDLE EAST AND AFRICA ECONOMIC SLOWDOWN LIMITS
5.4.2 ELECTRONIC COMPONENTS ARE PUSHING SMART GLASSES BOUNDARIES
6 IMPACT ANALYSIS OF COVID-19 ON MIDDLE EAST AND AFRICA WEARABLE CONFERENCING TECHNOLOGY MARKET
6.1 ANALYSIS ON IMPACT OF COVID-19 ON THE MARKET
6.2 STRATEGIC DECISION BY MANUFACTURERS AND GOVERNMENT INITIATIVES AFTER COVID-19
6.3 IMPACT ON DEMAND
6.4 PRICE IMPACT
6.5 IMPACT ON SUPPLY CHAIN
6.6 CONCLUSION
7 MIDDLE EAST AND AFRICA WEARABLE CONFERENCING TECHNOLOGY MARKET, BY OFFERING
7.1 OVERVIEW
7.2 HARDWARE
7.2.1 CAMERA
7.2.2 MICROPHONE
7.2.3 OTHERS
7.3 SOFTWARE
7.4 SERVICES
7.4.1 MANAGED SERVICES
7.4.2 PROFESSIONAL SERVICES
8 MIDDLE EAST AND AFRICA WEARABLE CONFERENCING TECHNOLOGY MARKET, BY CONFERENCING TYPE
8.1 OVERVIEW
8.2 VIDEO CONFERENCING
8.3 AUDIO CONFERENCING
9 MIDDLE EAST AND AFRICA WEARABLE CONFERENCING TECHNOLOGY MARKET, BY DEPLOYMENT MODE
9.1 OVERVIEW
9.2 ON-PREMISE
9.3 CLOUD
10 MIDDLE EAST AND AFRICA WEARABLE CONFERENCING TECHNOLOGY MARKET, BY ORGANIZATION SIZE
10.1 OVERVIEW
10.2 LARGE ORGANIZATION
10.3 SMALL & MEDIUM ORGANIZATION
11 MIDDLE EAST AND AFRICA WEARABLE CONFERENCING TECHNOLOGY MARKET, BY APPLICATION
11.1 OVERVIEW
11.2 ENTERPRISE
11.3 CONSUMER
12 MIDDLE EAST AND AFRICA WEARABLE CONFERENCING TECHNOLOGY MARKET, BY END USE
12.1 OVERVIEW
12.2 CORPORATE
12.2.1 MARKET BY DEPLOYMENT MODE
12.2.1.1 ON-PREMISE
12.2.1.2 CLOUD
12.2.2 MARKET BY ORGANIZATION SIZE
12.2.2.1 LARGE ORGANIZATION
12.2.2.2 SMALL & MEDIUM ORGANIZATION
12.3 EDUCATION
12.3.1 MARKET BY DEPLOYMENT MODE
12.3.1.1 ON-PREMISE
12.3.1.2 CLOUD
12.3.2 MARKET BY ORGANIZATION SIZE
12.3.2.1 LARGE ORGANIZATION
12.3.2.2 SMALL & MEDIUM ORGANIZATION
12.4 HEALTHCARE
12.4.1 MARKET BY DEPLOYMENT MODE
12.4.1.1 ON-PREMISE
12.4.1.2 CLOUD
12.4.2 MARKET BY ORGANIZATION SIZE
12.4.2.1 LARGE ORGANIZATION
12.4.2.2 SMALL & MEDIUM ORGANIZATION
12.5 GOVERNMENT AND DEFENSE
12.5.1 MARKET BY DEPLOYMENT MODE
12.5.1.1 ON-PREMISE
12.5.1.2 CLOUD
12.5.2 MARKET BY ORGANIZATION SIZE
12.5.2.1 LARGE ORGANIZATION
12.5.2.2 SMALL & MEDIUM ORGANIZATION
12.6 MEDIA AND ENTERTAINMENT
12.6.1 MARKET BY DEPLOYMENT MODE
12.6.1.1 ON-PREMISE
12.6.1.2 CLOUD
12.6.2 MARKET BY ORGANIZATION SIZE
12.6.2.1 LARGE ORGANIZATION
12.6.2.2 SMALL & MEDIUM ORGANIZATION
12.7 BANKING, FINANCIAL SERVICES AND INSURANCE (BFSI)
12.7.1 MARKET BY DEPLOYMENT MODE
12.7.1.1 ON-PREMISE
12.7.1.2 CLOUD
12.7.2 MARKET BY ORGANIZATION SIZE
12.7.2.1 LARGE ORGANIZATION
12.7.2.2 SMALL & MEDIUM ORGANIZATION
12.8 OTHER
12.8.1 MARKET BY DEPLOYMENT MODE
12.8.1.1 ON-PREMISE
12.8.1.2 CLOUD
12.8.2 MARKET BY ORGANIZATION SIZE
12.8.2.1 LARGE ORGANIZATION
12.8.2.2 SMALL & MEDIUM ORGANIZATION
13 MIDDLE EAST AND AFRICA WEARABLE CONFERENCING TECHNOLOGY MARKET, BY REGION
13.1 MIDDLE EAST & AFRICA
13.1.1 SOUTH AFRICA
13.1.2 SAUDI ARABIA
13.1.3 ISRAEL
13.1.4 U.A.E.
13.1.5 EGYPT
13.1.6 REST OF MIDDLE EAST & AFRICA
14 MIDDLE EAST AND AFRICA WEARABLE CONFERENCING TECHNOLOGY MARKET: COMPANY LANDSCAPE
14.1 COMPANY SHARE ANALYSIS: MIDDLE EAST AND AFRICA
15 SWOT ANALYSIS
16 COMPANY PROFILE
16.1 GOOGLE (A SUBSIDIARY OF ALPHABET INC.)
16.1.1 COMPANY SNAPSHOT
16.1.2 REVENUE ANALYSIS
16.1.3 COMPANY SHARE ANALYSIS
16.1.4 PRODUCT PORTFOLIO
16.1.5 RECENT DEVELOPMENTS
16.2 MICROSOFT
16.2.1 COMPANY SNAPSHOT
16.2.2 REVENUE ANALYSIS
16.2.3 COMPANY SHARE ANALYSIS
16.2.4 PRODUCT PORTFOLIO
16.2.5 RECENT DEVELOPMENTS
16.3 LENEVO
16.3.1 COMPANY SNAPSHOT
16.3.2 REVENUE ANALYSIS
16.3.3 COMPANY SHARE ANALYSIS
16.3.4 PRODUCT PORTFOLIO
16.3.5 RECENT DEVELOPMENT
16.4 RICOH
16.4.1 COMPANY SNAPSHOT
16.4.2 REVENUE ANALYSIS
16.4.3 COMPANY SHARE ANALYSIS
16.4.4 PRODUCT PORTFOLIO
16.4.5 RECENT DEVELOPMENTS
16.5 SEIKO EPSON CORPORATION
16.5.1 COMPANY SNAPSHOT
16.5.2 REVENUE ANALYSIS
16.5.3 PRODUCT PORTFOLIO
16.5.4 RECENT DEVELOPMENTS
16.6 CHIRONIX
16.6.1 COMPANY SNAPSHOT
16.6.2 PRODUCT PORTFOLIO
16.6.3 RECENT DEVELOPMENT
16.7 DIALPAD, INC.
16.7.1 COMPANY SNAPSHOT
16.7.2 PRODUCT PORTFOLIO
16.7.3 RECENT DEVELOPMENT
16.8 EON REALITY
16.8.1 COMPANY SNAPSHOT
16.8.2 PRODUCT PORTFOLIO
16.8.3 RECENT DEVELOPMENTS
16.9 EZTALKS
16.9.1 COMPANY SNAPSHOT
16.9.2 PRODUCT PORTFOLIO
16.9.3 RECENT DEVELOPMENT
16.1 HTC CORPORATION
16.10.1 COMPANY PROFILE
16.10.2 REVENUE ANALYSIS
16.10.3 PRODUCT PORTFOLIO
16.10.4 RECENT DEVELOPMENTS
16.11 IRISTICK
16.11.1 COMPANY SNAPSHOT
16.11.2 PRODUCT PORTFOLIO
16.11.3 RECENT DEVELOPMENT
16.12 LOGITECH
16.12.1 COMPANY SNAPSHOT
16.12.2 REVENUE ANALYSIS
16.12.3 PRODUCT PORTFOLIO
16.12.4 RECENT DEVELOPMENTS
16.13 LOGMEIN, INC.
16.13.1 COMPANY SNAPSHOT
16.13.2 PRODUCT PORTFOLIO
16.13.3 RECENT DEVELOPMENTS
16.14 REALWEAR, INC.
16.14.1 COMPANY SNAPSHOT
16.14.2 PRODUCT PORTFOLIO
16.14.3 RECENT DEVELOPMENT
16.15 ROBERT BOSCH GMBH
16.15.1 COMPANY SNAPSHOT
16.15.2 REVENUE ANALYSIS
16.15.3 PRODUCT PORTFOLIO
16.15.4 RECENT DEVELOPMENT
16.16 SONY CORPORATION
16.16.1 COMPANY SNAPSHOT
16.16.2 REVENUE ANALYSIS
16.16.3 PRODUCT PORTFOLIO
16.16.4 RECENT DEVELOPMENTS
16.17 TEAMVIEWER
16.17.1 COMPANY SNAPSHOT
16.17.2 REVNUE ANALYSIS
16.17.3 PRODUCT PORTFOLIO
16.17.4 RECENT DEVELOPMENTS
16.18 VIDYO, INC.
16.18.1 COMPANY SNAPSHOT
16.18.2 PRODUCT PORTFOLIO
16.18.3 RECENT DEVELOPMENTS
16.19 VUZIX CORPORATION
16.19.1 COMPANY SNAPSHOT
16.19.2 REVENUE ANALYSIS
16.19.3 PRODUCT PORTFOLIO
16.19.4 RECENT DEVELOPMENT
16.2 ZOOM VIDEO COMMUNICATIONS, INC.
16.20.1 COMPANY SNAPSHOT
16.20.2 REVENUE ANALYSIS
16.20.3 COMPANY SHARE ANALYSIS
16.20.4 PRODUCT PORTFOLIO
16.20.5 RECENT DEVELOPMENTS
17 QUESTIONNAIRE
18 RELATED REPORTS
List of Table
TABLE 1 MIDDLE EAST AND AFRICA WEARABLE CONFERENCING TECHNOLOGY MARKET, BY OFFERING, 2020-2029 (USD MILLION)
TABLE 2 MIDDLE EAST AND AFRICA HARDWARE IN WEARABLE CONFERENCING TECHNOLOGY MARKET, BY REGION, 2020-2029 (USD MILLION)
TABLE 3 MIDDLE EAST AND AFRICA HARDWARE IN WEARABLE CONFERENCING TECHNOLOGY MARKET, BY TYPE, 2020-2029 (USD MILLION)
TABLE 4 MIDDLE EAST AND AFRICA SOFTWARE IN WEARABLE CONFERENCING TECHNOLOGY MARKET, BY REGION, 2020-2029 (USD MILLION)
TABLE 5 MIDDLE EAST AND AFRICA SERVICES IN WEARABLE CONFERENCING TECHNOLOGY MARKET, BY REGION, 2020-2029 (USD MILLION)
TABLE 6 MIDDLE EAST AND AFRICA SERVICES IN WEARABLE CONFERENCING TECHNOLOGY MARKET, BY TYPE, 2020-2029 (USD MILLION)
TABLE 7 MIDDLE EAST AND AFRICA WEARABLE CONFERENCING TECHNOLOGY MARKET, BY CONFERENCING TYPE, 2020-2029 (USD MILLION)
TABLE 8 MIDDLE EAST AND AFRICA VIDEO CONFERENCING IN WEARABLE CONFERENCING TECHNOLOGY MARKET, BY REGION, 2020-2029 (USD MILLION)
TABLE 9 MIDDLE EAST AND AFRICA AUDIO CONFERENCING IN WEARABLE CONFERENCING TECHNOLOGY MARKET, BY REGION, 2020-2029 (USD MILLION)
TABLE 10 MIDDLE EAST AND AFRICA WEARABLE CONFERENCING TECHNOLOGY MARKET, BY DEPLOYMENT MODE, 2020-2029 (USD MILLION)
TABLE 11 MIDDLE EAST AND AFRICA ON-PREMISE IN WEARABLE CONFERENCING TECHNOLOGY MARKET, BY REGION, 2020-2029 (USD MILLION)
TABLE 12 MIDDLE EAST AND AFRICA CLOUD IN WEARABLE CONFERENCING TECHNOLOGY MARKET, BY REGION, 2020-2029 (USD MILLION)
TABLE 13 MIDDLE EAST AND AFRICA WEARABLE CONFERENCING TECHNOLOGY MARKET, BY ORGANIZATION SIZE, 2020-2029 (USD MILLION)
TABLE 14 MIDDLE EAST AND AFRICA LARGE ORGANIZATION IN WEARABLE CONFERENCING TECHNOLOGY MARKET, BY REGION, 2020-2029 (USD MILLION)
TABLE 15 MIDDLE EAST AND AFRICA SMALL & MEDIUM ORGANIZATION IN WEARABLE CONFERENCING TECHNOLOGY MARKET, BY REGION, 2020-2029 (USD MILLION)
TABLE 16 MIDDLE EAST AND AFRICA WEARABLE CONFERENCING TECHNOLOGY MARKET, BY APPLICATION, 2020-2029 (USD MILLION)
TABLE 17 MIDDLE EAST AND AFRICA ENTERPRISE IN WEARABLE CONFERENCING TECHNOLOGY MARKET, BY REGION, 2020-2029 (USD MILLION)
TABLE 18 MIDDLE EAST AND AFRICA CONSUMER IN WEARABLE CONFERENCING TECHNOLOGY MARKET, BY REGION, 2020-2029 (USD MILLION)
TABLE 19 MIDDLE EAST AND AFRICA WEARABLE CONFERENCING TECHNOLOGY MARKET, BY END USE, 2020-2029 (USD MILLION)
TABLE 20 MIDDLE EAST AND AFRICA CORPORATE IN WEARABLE CONFERENCING TECHNOLOGY MARKET, BY REGION, 2020-2029 (USD MILLION)
TABLE 21 MIDDLE EAST AND AFRICA CORPORATE IN WEARABLE CONFERENCING TECHNOLOGY MARKET, BY DEPLOYMENT MODE, 2020-2029 (USD MILLION)
TABLE 22 MIDDLE EAST AND AFRICA CORPORATE IN WEARABLE CONFERENCING TECHNOLOGY MARKET, BY ORGANIZATION SIZE, 2020-2029 (USD MILLION)
TABLE 23 MIDDLE EAST AND AFRICA EDUCATION IN WEARABLE CONFERENCING TECHNOLOGY MARKET, BY REGION, 2020-2029 (USD MILLION)
TABLE 24 MIDDLE EAST AND AFRICA EDUCATION IN WEARABLE CONFERENCING TECHNOLOGY MARKET, BY DEPLOYMENT MODE, 2020-2029 (USD MILLION)
TABLE 25 MIDDLE EAST AND AFRICA EDUCATION IN WEARABLE CONFERENCING TECHNOLOGY MARKET, BY ORGANIZATION SIZE, 2020-2029 (USD MILLION)
TABLE 26 MIDDLE EAST AND AFRICA HEALTHCARE IN WEARABLE CONFERENCING TECHNOLOGY MARKET, BY REGION, 2020-2029 (USD MILLION)
TABLE 27 MIDDLE EAST AND AFRICA HEALTHCARE IN WEARABLE CONFERENCING TECHNOLOGY MARKET, BY DEPLOYMENT MODE, 2020-2029 (USD MILLION)
TABLE 28 MIDDLE EAST AND AFRICA HEALTHCARE IN WEARABLE CONFERENCING TECHNOLOGY MARKET, BY ORGANIZATION SIZE, 2020-2029 (USD MILLION)
TABLE 29 MIDDLE EAST AND AFRICA GOVERNMENT AND DEFENSE IN WEARABLE CONFERENCING TECHNOLOGY MARKET, BY REGION, 2020-2029 (USD MILLION)
TABLE 30 MIDDLE EAST AND AFRICA GOVERNMENT AND DEFENSE IN WEARABLE CONFERENCING TECHNOLOGY MARKET, BY DEPLOYMENT MODE, 2020-2029 (USD MILLION)
TABLE 31 MIDDLE EAST AND AFRICA GOVERNMENT AND DEFENSE IN WEARABLE CONFERENCING TECHNOLOGY MARKET, BY ORGANIZATION SIZE, 2020-2029 (USD MILLION)
TABLE 32 MIDDLE EAST AND AFRICA MEDIA AND ENTERTAINMENT IN WEARABLE CONFERENCING TECHNOLOGY MARKET, BY REGION, 2020-2029 (USD MILLION)
TABLE 33 MIDDLE EAST AND AFRICA MEDIA AND ENTERTAINMENT IN WEARABLE CONFERENCING TECHNOLOGY MARKET, BY DEPLOYMENT MODE, 2020-2029 (USD MILLION)
TABLE 34 MIDDLE EAST AND AFRICA MEDIA AND ENTERTAINMENT IN WEARABLE CONFERENCING TECHNOLOGY MARKET, BY ORGANIZATION SIZE, 2020-2029 (USD MILLION)
TABLE 35 MIDDLE EAST AND AFRICA BANKING, FINANCIAL SERVICES AND INSURANCE (BFSI) IN WEARABLE CONFERENCING TECHNOLOGY MARKET, BY REGION, 2020-2029 (USD MILLION)
TABLE 36 MIDDLE EAST AND AFRICA BANKING, FINANCIAL SERVICES AND INSURANCE (BFSI) IN WEARABLE CONFERENCING TECHNOLOGY MARKET, BY DEPLOYMENT MODE, 2020-2029 (USD MILLION)
TABLE 37 MIDDLE EAST AND AFRICA BANKING, FINANCIAL SERVICES AND INSURANCE (BFSI) IN WEARABLE CONFERENCING TECHNOLOGY MARKET, BY ORGANIZATION SIZE, 2020-2029 (USD MILLION)
TABLE 38 MIDDLE EAST AND AFRICA OTHER IN WEARABLE CONFERENCING TECHNOLOGY MARKET, BY REGION, 2020-2029 (USD MILLION)
TABLE 39 MIDDLE EAST AND AFRICA OTHER IN WEARABLE CONFERENCING TECHNOLOGY MARKET, BY DEPLOYMENT MODE, 2020-2029 (USD MILLION)
TABLE 40 MIDDLE EAST AND AFRICA OTHER IN WEARABLE CONFERENCING TECHNOLOGY MARKET, BY ORGANIZATION SIZE, 2020-2029 (USD MILLION)
TABLE 41 MIDDLE EAST & AFRICA WEARABLE CONFERENCING TECHNOLOGY MARKET, BY COUNTRY, 2020-2029 (USD MILLION)
TABLE 42 MIDDLE EAST & AFRICA WEARABLE CONFERENCING TECHNOLOGY MARKET, BY OFFERING, 2020-2029 (USD MILLION)
TABLE 43 MIDDLE EAST & AFRICA HARDWARE IN WEARABLE CONFERENCING TECHNOLOGY MARKET, BY TYPE, 2020-2029 (USD MILLION)
TABLE 44 MIDDLE EAST & AFRICA SERVICES IN WEARABLE CONFERENCING TECHNOLOGY MARKET, BY TYPE, 2020-2029 (USD MILLION)
TABLE 45 MIDDLE EAST & AFRICA WEARABLE CONFERENCING TECHNOLOGY MARKET, BY CONFERENCING TYPE, 2020-2029 (USD MILLION)
TABLE 46 MIDDLE EAST & AFRICA WEARABLE CONFERENCING TECHNOLOGY MARKET, BY DEPLOYMENT MODE, 2020-2029 (USD MILLION)
TABLE 47 MIDDLE EAST & AFRICA WEARABLE CONFERENCING TECHNOLOGY MARKET, BY ORGANIZATION SIZE, 2020-2029 (USD MILLION)
TABLE 48 MIDDLE EAST & AFRICA WEARABLE CONFERENCING TECHNOLOGY MARKET, BY APPLICATION, 2020-2029 (USD MILLION)
TABLE 49 MIDDLE EAST & AFRICA WEARABLE CONFERENCING TECHNOLOGY MARKET, BY END USE, 2020-2029 (USD MILLION)
TABLE 50 MIDDLE EAST & AFRICA CORPORATE IN WEARABLE CONFERENCING TECHNOLOGY MARKET, BY DEPLOYMENT MODE, 2020-2029 (USD MILLION)
TABLE 51 MIDDLE EAST & AFRICA CORPORATE IN WEARABLE CONFERENCING TECHNOLOGY MARKET, BY ORGANIZATION SIZE, 2020-2029 (USD MILLION)
TABLE 52 MIDDLE EAST & AFRICA EDUCATION IN WEARABLE CONFERENCING TECHNOLOGY MARKET, BY DEPLOYMENT MODE, 2020-2029 (USD MILLION)
TABLE 53 MIDDLE EAST & AFRICA EDUCATION IN WEARABLE CONFERENCING TECHNOLOGY MARKET, BY ORGANIZATION SIZE, 2020-2029 (USD MILLION)
TABLE 54 MIDDLE EAST & AFRICA HEALTHCARE IN WEARABLE CONFERENCING TECHNOLOGY MARKET, BY DEPLOYMENT MODE, 2020-2029 (USD MILLION)
TABLE 55 MIDDLE EAST & AFRICA HEALTHCARE IN WEARABLE CONFERENCING TECHNOLOGY MARKET, BY ORGANIZATION SIZE, 2020-2029 (USD MILLION)
TABLE 56 MIDDLE EAST & AFRICA GOVERNMENT AND DEFENSE IN WEARABLE CONFERENCING TECHNOLOGY MARKET, BY DEPLOYMENT MODE, 2020-2029 (USD MILLION)
TABLE 57 MIDDLE EAST & AFRICA GOVERNMENT AND DEFENSE IN WEARABLE CONFERENCING TECHNOLOGY MARKET, BY ORGANIZATION SIZE, 2020-2029 (USD MILLION)
TABLE 58 MIDDLE EAST & AFRICA MEDIA AND ENTERTAINMENT IN WEARABLE CONFERENCING TECHNOLOGY MARKET, BY DEPLOYMENT MODE, 2020-2029 (USD MILLION)
TABLE 59 MIDDLE EAST & AFRICA MEDIA AND ENTERTAINMENT IN WEARABLE CONFERENCING TECHNOLOGY MARKET, BY ORGANIZATION SIZE, 2020-2029 (USD MILLION)
TABLE 60 MIDDLE EAST & AFRICA BANKING, FINANCIAL SERVICES AND INSURANCE (BFSI) IN WEARABLE CONFERENCING TECHNOLOGY MARKET, BY DEPLOYMENT MODE, 2020-2029 (USD MILLION)
TABLE 61 MIDDLE EAST & AFRICA BANKING, FINANCIAL SERVICES AND INSURANCE (BFSI) IN WEARABLE CONFERENCING TECHNOLOGY MARKET, BY ORGANIZATION SIZE, 2020-2029 (USD MILLION)
TABLE 62 MIDDLE EAST & AFRICA OTHER IN WEARABLE CONFERENCING TECHNOLOGY MARKET, BY DEPLOYMENT MODE, 2020-2029 (USD MILLION)
TABLE 63 MIDDLE EAST & AFRICA OTHER IN WEARABLE CONFERENCING TECHNOLOGY MARKET, BY ORGANIZATION SIZE, 2020-2029 (USD MILLION)
TABLE 64 SOUTH AFRICA WEARABLE CONFERENCING TECHNOLOGY MARKET, BY OFFERING, 2020-2029 (USD MILLION)
TABLE 65 SOUTH AFRICA HARDWARE IN WEARABLE CONFERENCING TECHNOLOGY MARKET, BY TYPE, 2020-2029 (USD MILLION)
TABLE 66 SOUTH AFRICA SERVICES IN WEARABLE CONFERENCING TECHNOLOGY MARKET, BY TYPE, 2020-2029 (USD MILLION)
TABLE 67 SOUTH AFRICA WEARABLE CONFERENCING TECHNOLOGY MARKET, BY CONFERENCING TYPE, 2020-2029 (USD MILLION)
TABLE 68 SOUTH AFRICA WEARABLE CONFERENCING TECHNOLOGY MARKET, BY DEPLOYMENT MODE, 2020-2029 (USD MILLION)
TABLE 69 SOUTH AFRICA WEARABLE CONFERENCING TECHNOLOGY MARKET, BY ORGANIZATION SIZE, 2020-2029 (USD MILLION)
TABLE 70 SOUTH AFRICA WEARABLE CONFERENCING TECHNOLOGY MARKET, BY APPLICATION, 2020-2029 (USD MILLION)
TABLE 71 SOUTH AFRICA WEARABLE CONFERENCING TECHNOLOGY MARKET, BY END USE, 2020-2029 (USD MILLION)
TABLE 72 SOUTH AFRICA CORPORATE IN WEARABLE CONFERENCING TECHNOLOGY MARKET, BY DEPLOYMENT MODE, 2020-2029 (USD MILLION)
TABLE 73 SOUTH AFRICA CORPORATE IN WEARABLE CONFERENCING TECHNOLOGY MARKET, BY ORGANIZATION SIZE, 2020-2029 (USD MILLION)
TABLE 74 SOUTH AFRICA EDUCATION IN WEARABLE CONFERENCING TECHNOLOGY MARKET, BY DEPLOYMENT MODE, 2020-2029 (USD MILLION)
TABLE 75 SOUTH AFRICA EDUCATION IN WEARABLE CONFERENCING TECHNOLOGY MARKET, BY ORGANIZATION SIZE, 2020-2029 (USD MILLION)
TABLE 76 SOUTH AFRICA HEALTHCARE IN WEARABLE CONFERENCING TECHNOLOGY MARKET, BY DEPLOYMENT MODE, 2020-2029 (USD MILLION)
TABLE 77 SOUTH AFRICA HEALTHCARE IN WEARABLE CONFERENCING TECHNOLOGY MARKET, BY ORGANIZATION SIZE, 2020-2029 (USD MILLION)
TABLE 78 SOUTH AFRICA GOVERNMENT AND DEFENSE IN WEARABLE CONFERENCING TECHNOLOGY MARKET, BY DEPLOYMENT MODE, 2020-2029 (USD MILLION)
TABLE 79 SOUTH AFRICA GOVERNMENT AND DEFENSE IN WEARABLE CONFERENCING TECHNOLOGY MARKET, BY ORGANIZATION SIZE, 2020-2029 (USD MILLION)
TABLE 80 SOUTH AFRICA MEDIA AND ENTERTAINMENT IN WEARABLE CONFERENCING TECHNOLOGY MARKET, BY DEPLOYMENT MODE, 2020-2029 (USD MILLION)
TABLE 81 SOUTH AFRICA MEDIA AND ENTERTAINMENT IN WEARABLE CONFERENCING TECHNOLOGY MARKET, BY ORGANIZATION SIZE, 2020-2029 (USD MILLION)
TABLE 82 SOUTH AFRICA BANKING, FINANCIAL SERVICES AND INSURANCE (BFSI) IN WEARABLE CONFERENCING TECHNOLOGY MARKET, BY DEPLOYMENT MODE, 2020-2029 (USD MILLION)
TABLE 83 SOUTH AFRICA BANKING, FINANCIAL SERVICES AND INSURANCE (BFSI) IN WEARABLE CONFERENCING TECHNOLOGY MARKET, BY ORGANIZATION SIZE, 2020-2029 (USD MILLION)
TABLE 84 SOUTH AFRICA OTHER IN WEARABLE CONFERENCING TECHNOLOGY MARKET, BY DEPLOYMENT MODE, 2020-2029 (USD MILLION)
TABLE 85 SOUTH AFRICA OTHER IN WEARABLE CONFERENCING TECHNOLOGY MARKET, BY ORGANIZATION SIZE, 2020-2029 (USD MILLION)
TABLE 86 SAUDI ARABIA WEARABLE CONFERENCING TECHNOLOGY MARKET, BY OFFERING, 2020-2029 (USD MILLION)
TABLE 87 SAUDI ARABIA HARDWARE IN WEARABLE CONFERENCING TECHNOLOGY MARKET, BY TYPE, 2020-2029 (USD MILLION)
TABLE 88 SAUDI ARABIA SERVICES IN WEARABLE CONFERENCING TECHNOLOGY MARKET, BY TYPE, 2020-2029 (USD MILLION)
TABLE 89 SAUDI ARABIA WEARABLE CONFERENCING TECHNOLOGY MARKET, BY CONFERENCING TYPE, 2020-2029 (USD MILLION)
TABLE 90 SAUDI ARABIA WEARABLE CONFERENCING TECHNOLOGY MARKET, BY DEPLOYMENT MODE, 2020-2029 (USD MILLION)
TABLE 91 SAUDI ARABIA WEARABLE CONFERENCING TECHNOLOGY MARKET, BY ORGANIZATION SIZE, 2020-2029 (USD MILLION)
TABLE 92 SAUDI ARABIA WEARABLE CONFERENCING TECHNOLOGY MARKET, BY APPLICATION, 2020-2029 (USD MILLION)
TABLE 93 SAUDI ARABIA WEARABLE CONFERENCING TECHNOLOGY MARKET, BY END USE, 2020-2029 (USD MILLION)
TABLE 94 SAUDI ARABIA CORPORATE IN WEARABLE CONFERENCING TECHNOLOGY MARKET, BY DEPLOYMENT MODE, 2020-2029 (USD MILLION)
TABLE 95 SAUDI ARABIA CORPORATE IN WEARABLE CONFERENCING TECHNOLOGY MARKET, BY ORGANIZATION SIZE, 2020-2029 (USD MILLION)
TABLE 96 SAUDI ARABIA EDUCATION IN WEARABLE CONFERENCING TECHNOLOGY MARKET, BY DEPLOYMENT MODE, 2020-2029 (USD MILLION)
TABLE 97 SAUDI ARABIA EDUCATION IN WEARABLE CONFERENCING TECHNOLOGY MARKET, BY ORGANIZATION SIZE, 2020-2029 (USD MILLION)
TABLE 98 SAUDI ARABIA HEALTHCARE IN WEARABLE CONFERENCING TECHNOLOGY MARKET, BY DEPLOYMENT MODE, 2020-2029 (USD MILLION)
TABLE 99 SAUDI ARABIA HEALTHCARE IN WEARABLE CONFERENCING TECHNOLOGY MARKET, BY ORGANIZATION SIZE, 2020-2029 (USD MILLION)
TABLE 100 SAUDI ARABIA GOVERNMENT AND DEFENSE IN WEARABLE CONFERENCING TECHNOLOGY MARKET, BY DEPLOYMENT MODE, 2020-2029 (USD MILLION)
TABLE 101 SAUDI ARABIA GOVERNMENT AND DEFENSE IN WEARABLE CONFERENCING TECHNOLOGY MARKET, BY ORGANIZATION SIZE, 2020-2029 (USD MILLION)
TABLE 102 SAUDI ARABIA MEDIA AND ENTERTAINMENT IN WEARABLE CONFERENCING TECHNOLOGY MARKET, BY DEPLOYMENT MODE, 2020-2029 (USD MILLION)
TABLE 103 SAUDI ARABIA MEDIA AND ENTERTAINMENT IN WEARABLE CONFERENCING TECHNOLOGY MARKET, BY ORGANIZATION SIZE, 2020-2029 (USD MILLION)
TABLE 104 SAUDI ARABIA BANKING, FINANCIAL SERVICES AND INSURANCE (BFSI) IN WEARABLE CONFERENCING TECHNOLOGY MARKET, BY DEPLOYMENT MODE, 2020-2029 (USD MILLION)
TABLE 105 SAUDI ARABIA BANKING, FINANCIAL SERVICES AND INSURANCE (BFSI) IN WEARABLE CONFERENCING TECHNOLOGY MARKET, BY ORGANIZATION SIZE, 2020-2029 (USD MILLION)
TABLE 106 SAUDI ARABIA OTHER IN WEARABLE CONFERENCING TECHNOLOGY MARKET, BY DEPLOYMENT MODE, 2020-2029 (USD MILLION)
TABLE 107 SAUDI ARABIA OTHER IN WEARABLE CONFERENCING TECHNOLOGY MARKET, BY ORGANIZATION SIZE, 2020-2029 (USD MILLION)
TABLE 108 ISRAEL WEARABLE CONFERENCING TECHNOLOGY MARKET, BY OFFERING, 2020-2029 (USD MILLION)
TABLE 109 ISRAEL HARDWARE IN WEARABLE CONFERENCING TECHNOLOGY MARKET, BY TYPE, 2020-2029 (USD MILLION)
TABLE 110 ISRAEL SERVICES IN WEARABLE CONFERENCING TECHNOLOGY MARKET, BY TYPE, 2020-2029 (USD MILLION)
TABLE 111 ISRAEL WEARABLE CONFERENCING TECHNOLOGY MARKET, BY CONFERENCING TYPE, 2020-2029 (USD MILLION)
TABLE 112 ISRAEL WEARABLE CONFERENCING TECHNOLOGY MARKET, BY DEPLOYMENT MODE, 2020-2029 (USD MILLION)
TABLE 113 ISRAEL WEARABLE CONFERENCING TECHNOLOGY MARKET, BY ORGANIZATION SIZE, 2020-2029 (USD MILLION)
TABLE 114 ISRAEL WEARABLE CONFERENCING TECHNOLOGY MARKET, BY APPLICATION, 2020-2029 (USD MILLION)
TABLE 115 ISRAEL WEARABLE CONFERENCING TECHNOLOGY MARKET, BY END USE, 2020-2029 (USD MILLION)
TABLE 116 ISRAEL CORPORATE IN WEARABLE CONFERENCING TECHNOLOGY MARKET, BY DEPLOYMENT MODE, 2020-2029 (USD MILLION)
TABLE 117 ISRAEL CORPORATE IN WEARABLE CONFERENCING TECHNOLOGY MARKET, BY ORGANIZATION SIZE, 2020-2029 (USD MILLION)
TABLE 118 ISRAEL EDUCATION IN WEARABLE CONFERENCING TECHNOLOGY MARKET, BY DEPLOYMENT MODE, 2020-2029 (USD MILLION)
TABLE 119 ISRAEL EDUCATION IN WEARABLE CONFERENCING TECHNOLOGY MARKET, BY ORGANIZATION SIZE, 2020-2029 (USD MILLION)
TABLE 120 ISRAEL HEALTHCARE IN WEARABLE CONFERENCING TECHNOLOGY MARKET, BY DEPLOYMENT MODE, 2020-2029 (USD MILLION)
TABLE 121 ISRAEL HEALTHCARE IN WEARABLE CONFERENCING TECHNOLOGY MARKET, BY ORGANIZATION SIZE, 2020-2029 (USD MILLION)
TABLE 122 ISRAEL GOVERNMENT AND DEFENSE IN WEARABLE CONFERENCING TECHNOLOGY MARKET, BY DEPLOYMENT MODE, 2020-2029 (USD MILLION)
TABLE 123 ISRAEL GOVERNMENT AND DEFENSE IN WEARABLE CONFERENCING TECHNOLOGY MARKET, BY ORGANIZATION SIZE, 2020-2029 (USD MILLION)
TABLE 124 ISRAEL MEDIA AND ENTERTAINMENT IN WEARABLE CONFERENCING TECHNOLOGY MARKET, BY DEPLOYMENT MODE, 2020-2029 (USD MILLION)
TABLE 125 ISRAEL MEDIA AND ENTERTAINMENT IN WEARABLE CONFERENCING TECHNOLOGY MARKET, BY ORGANIZATION SIZE, 2020-2029 (USD MILLION)
TABLE 126 ISRAEL BANKING, FINANCIAL SERVICES AND INSURANCE (BFSI) IN WEARABLE CONFERENCING TECHNOLOGY MARKET, BY DEPLOYMENT MODE, 2020-2029 (USD MILLION)
TABLE 127 ISRAEL BANKING, FINANCIAL SERVICES AND INSURANCE (BFSI) IN WEARABLE CONFERENCING TECHNOLOGY MARKET, BY ORGANIZATION SIZE, 2020-2029 (USD MILLION)
TABLE 128 ISRAEL OTHER IN WEARABLE CONFERENCING TECHNOLOGY MARKET, BY DEPLOYMENT MODE, 2020-2029 (USD MILLION)
TABLE 129 ISRAEL OTHER IN WEARABLE CONFERENCING TECHNOLOGY MARKET, BY ORGANIZATION SIZE, 2020-2029 (USD MILLION)
TABLE 130 U.A.E. WEARABLE CONFERENCING TECHNOLOGY MARKET, BY OFFERING, 2020-2029 (USD MILLION)
TABLE 131 U.A.E. HARDWARE IN WEARABLE CONFERENCING TECHNOLOGY MARKET, BY TYPE, 2020-2029 (USD MILLION)
TABLE 132 U.A.E. SERVICES IN WEARABLE CONFERENCING TECHNOLOGY MARKET, BY TYPE, 2020-2029 (USD MILLION)
TABLE 133 U.A.E. WEARABLE CONFERENCING TECHNOLOGY MARKET, BY CONFERENCING TYPE, 2020-2029 (USD MILLION)
TABLE 134 U.A.E. WEARABLE CONFERENCING TECHNOLOGY MARKET, BY DEPLOYMENT MODE, 2020-2029 (USD MILLION)
TABLE 135 U.A.E. WEARABLE CONFERENCING TECHNOLOGY MARKET, BY ORGANIZATION SIZE, 2020-2029 (USD MILLION)
TABLE 136 U.A.E. WEARABLE CONFERENCING TECHNOLOGY MARKET, BY APPLICATION, 2020-2029 (USD MILLION)
TABLE 137 U.A.E. WEARABLE CONFERENCING TECHNOLOGY MARKET, BY END USE, 2020-2029 (USD MILLION)
TABLE 138 U.A.E. CORPORATE IN WEARABLE CONFERENCING TECHNOLOGY MARKET, BY DEPLOYMENT MODE, 2020-2029 (USD MILLION)
TABLE 139 U.A.E. CORPORATE IN WEARABLE CONFERENCING TECHNOLOGY MARKET, BY ORGANIZATION SIZE, 2020-2029 (USD MILLION)
TABLE 140 U.A.E. EDUCATION IN WEARABLE CONFERENCING TECHNOLOGY MARKET, BY DEPLOYMENT MODE, 2020-2029 (USD MILLION)
TABLE 141 U.A.E. EDUCATION IN WEARABLE CONFERENCING TECHNOLOGY MARKET, BY ORGANIZATION SIZE, 2020-2029 (USD MILLION)
TABLE 142 U.A.E. HEALTHCARE IN WEARABLE CONFERENCING TECHNOLOGY MARKET, BY DEPLOYMENT MODE, 2020-2029 (USD MILLION)
TABLE 143 U.A.E. HEALTHCARE IN WEARABLE CONFERENCING TECHNOLOGY MARKET, BY ORGANIZATION SIZE, 2020-2029 (USD MILLION)
TABLE 144 U.A.E. GOVERNMENT AND DEFENSE IN WEARABLE CONFERENCING TECHNOLOGY MARKET, BY DEPLOYMENT MODE, 2020-2029 (USD MILLION)
TABLE 145 U.A.E. GOVERNMENT AND DEFENSE IN WEARABLE CONFERENCING TECHNOLOGY MARKET, BY ORGANIZATION SIZE, 2020-2029 (USD MILLION)
TABLE 146 U.A.E. MEDIA AND ENTERTAINMENT IN WEARABLE CONFERENCING TECHNOLOGY MARKET, BY DEPLOYMENT MODE, 2020-2029 (USD MILLION)
TABLE 147 U.A.E. MEDIA AND ENTERTAINMENT IN WEARABLE CONFERENCING TECHNOLOGY MARKET, BY ORGANIZATION SIZE, 2020-2029 (USD MILLION)
TABLE 148 U.A.E. BANKING, FINANCIAL SERVICES AND INSURANCE (BFSI) IN WEARABLE CONFERENCING TECHNOLOGY MARKET, BY DEPLOYMENT MODE, 2020-2029 (USD MILLION)
TABLE 149 U.A.E. BANKING, FINANCIAL SERVICES AND INSURANCE (BFSI) IN WEARABLE CONFERENCING TECHNOLOGY MARKET, BY ORGANIZATION SIZE, 2020-2029 (USD MILLION)
TABLE 150 U.A.E. OTHER IN WEARABLE CONFERENCING TECHNOLOGY MARKET, BY DEPLOYMENT MODE, 2020-2029 (USD MILLION)
TABLE 151 U.A.E. OTHER IN WEARABLE CONFERENCING TECHNOLOGY MARKET, BY ORGANIZATION SIZE, 2020-2029 (USD MILLION)
TABLE 152 EGYPT WEARABLE CONFERENCING TECHNOLOGY MARKET, BY OFFERING, 2020-2029 (USD MILLION)
TABLE 153 EGYPT HARDWARE IN WEARABLE CONFERENCING TECHNOLOGY MARKET, BY TYPE, 2020-2029 (USD MILLION)
TABLE 154 EGYPT SERVICES IN WEARABLE CONFERENCING TECHNOLOGY MARKET, BY TYPE, 2020-2029 (USD MILLION)
TABLE 155 EGYPT WEARABLE CONFERENCING TECHNOLOGY MARKET, BY CONFERENCING TYPE, 2020-2029 (USD MILLION)
TABLE 156 EGYPT WEARABLE CONFERENCING TECHNOLOGY MARKET, BY DEPLOYMENT MODE, 2020-2029 (USD MILLION)
TABLE 157 EGYPT WEARABLE CONFERENCING TECHNOLOGY MARKET, BY ORGANIZATION SIZE, 2020-2029 (USD MILLION)
TABLE 158 EGYPT WEARABLE CONFERENCING TECHNOLOGY MARKET, BY APPLICATION, 2020-2029 (USD MILLION)
TABLE 159 EGYPT WEARABLE CONFERENCING TECHNOLOGY MARKET, BY END USE, 2020-2029 (USD MILLION)
TABLE 160 EGYPT CORPORATE IN WEARABLE CONFERENCING TECHNOLOGY MARKET, BY DEPLOYMENT MODE, 2020-2029 (USD MILLION)
TABLE 161 EGYPT CORPORATE IN WEARABLE CONFERENCING TECHNOLOGY MARKET, BY ORGANIZATION SIZE, 2020-2029 (USD MILLION)
TABLE 162 EGYPT EDUCATION IN WEARABLE CONFERENCING TECHNOLOGY MARKET, BY DEPLOYMENT MODE, 2020-2029 (USD MILLION)
TABLE 163 EGYPT EDUCATION IN WEARABLE CONFERENCING TECHNOLOGY MARKET, BY ORGANIZATION SIZE, 2020-2029 (USD MILLION)
TABLE 164 EGYPT HEALTHCARE IN WEARABLE CONFERENCING TECHNOLOGY MARKET, BY DEPLOYMENT MODE, 2020-2029 (USD MILLION)
TABLE 165 EGYPT HEALTHCARE IN WEARABLE CONFERENCING TECHNOLOGY MARKET, BY ORGANIZATION SIZE, 2020-2029 (USD MILLION)
TABLE 166 EGYPT GOVERNMENT AND DEFENSE IN WEARABLE CONFERENCING TECHNOLOGY MARKET, BY DEPLOYMENT MODE, 2020-2029 (USD MILLION)
TABLE 167 EGYPT GOVERNMENT AND DEFENSE IN WEARABLE CONFERENCING TECHNOLOGY MARKET, BY ORGANIZATION SIZE, 2020-2029 (USD MILLION)
TABLE 168 EGYPT MEDIA AND ENTERTAINMENT IN WEARABLE CONFERENCING TECHNOLOGY MARKET, BY DEPLOYMENT MODE, 2020-2029 (USD MILLION)
TABLE 169 EGYPT MEDIA AND ENTERTAINMENT IN WEARABLE CONFERENCING TECHNOLOGY MARKET, BY ORGANIZATION SIZE, 2020-2029 (USD MILLION)
TABLE 170 EGYPT BANKING, FINANCIAL SERVICES AND INSURANCE (BFSI) IN WEARABLE CONFERENCING TECHNOLOGY MARKET, BY DEPLOYMENT MODE, 2020-2029 (USD MILLION)
TABLE 171 EGYPT BANKING, FINANCIAL SERVICES AND INSURANCE (BFSI) IN WEARABLE CONFERENCING TECHNOLOGY MARKET, BY ORGANIZATION SIZE, 2020-2029 (USD MILLION)
TABLE 172 EGYPT OTHER IN WEARABLE CONFERENCING TECHNOLOGY MARKET, BY DEPLOYMENT MODE, 2020-2029 (USD MILLION)
TABLE 173 EGYPT OTHER IN WEARABLE CONFERENCING TECHNOLOGY MARKET, BY ORGANIZATION SIZE, 2020-2029 (USD MILLION)
TABLE 174 REST OF MIDDLE EAST & AFRICA WEARABLE CONFERENCING TECHNOLOGY MARKET, BY OFFERING, 2020-2029 (USD MILLION)
List of Figure
FIGURE 1 MIDDLE EAST AND AFRICA WEARABLE CONFERENCING TECHNOLOGY MARKET: SEGMENTATION
FIGURE 2 MIDDLE EAST AND AFRICA WEARABLE CONFERENCING TECHNOLOGY MARKET: DATA TRIANGULATION
FIGURE 3 MIDDLE EAST AND AFRICA WEARABLE CONFERENCING TECHNOLOGY MARKET: DROC ANALYSIS
FIGURE 4 MIDDLE EAST AND AFRICA WEARABLE CONFERENCING TECHNOLOGY MARKET: MIDDLE EAST AND AFRICA VS REGIONAL MARKET ANALYSIS
FIGURE 5 MIDDLE EAST AND AFRICA WEARABLE CONFERENCING TECHNOLOGY MARKET: COMPANY RESEARCH ANALYSIS
FIGURE 6 MIDDLE EAST AND AFRICA WEARABLE CONFERENCING TECHNOLOGY MARKET: INTERVIEW DEMOGRAPHICS
FIGURE 7 MIDDLE EAST AND AFRICA WEARABLE CONFERENCING TECHNOLOGY MARKET: DBMR MARKET POSITION GRID
FIGURE 8 MIDDLE EAST AND AFRICA WEARABLE CONFERENCING TECHNOLOGY MARKET: VENDOR SHARE ANALYSIS
FIGURE 9 MIDDLE EAST AND AFRICA WEARABLE CONFERENCING TECHNOLOGY MARKET: MARKET APPLICATION COVERAGE GRID
FIGURE 10 MIDDLE EAST AND AFRICA WEARABLE CONFERENCING TECHNOLOGY MARKET: SEGMENTATION
FIGURE 11 RISING PREFERENCE FOR REMOTE WORKING IS EXPECTED TO DRIVE MIDDLE EAST AND AFRICA WEARABLE CONFERENCING TECHNOLOGY MARKETIN THE FORECAST PERIOD OF 2022 TO 2029
FIGURE 12 TYPE SEGMENT IS EXPECTED TO ACCOUNT FOR THE LARGEST SHARE OF MIDDLE EAST AND AFRICA WEARABLE CONFERENCING TECHNOLOGY MARKETIN 2022 & 2029
FIGURE 13 ASIA-PACIFIC IS EXPECTED TO DOMINATE AND IS THE FASTEST GROWING REGION IN THE MIDDLE EAST AND AFRICA WEARABLE CONFERENCING TECHNOLOGY MARKETIN THE FORECAST PERIOD OF 2022 TO 2029
FIGURE 14 ASIA-PACIFIC IS THE FASTEST GROWING MARKET FOR WEARABLE CONFERENCING TECHNOLOGYMANUFACTURERS IN THE FORECAST PERIOD OF 2022 TO 2029
FIGURE 15 DRIVERS, RESTRAINTS, OPPORTUNITIES, AND CHALLENGES OF MIDDLE EAST AND AFRICA WEARABLE CONFERENCING TECHNOLOGY MARKET
FIGURE 16 MIDDLE EAST AND AFRICA WEARABLE CONFERENCING TECHNOLOGY MARKET: BY OFFERING, 2021
FIGURE 17 MIDDLE EAST AND AFRICA WEARABLE CONFERENCING TECHNOLOGY MARKET: BY CONFERENCING TYPE, 2021
FIGURE 18 MIDDLE EAST AND AFRICA WEARABLE CONFERENCING TECHNOLOGY MARKET: BY DEPLOYMENT MODE, 2021
FIGURE 19 MIDDLE EAST AND AFRICA WEARABLE CONFERENCING TECHNOLOGY MARKET: BY ORGANIZATION SIZE, 2021
FIGURE 20 MIDDLE EAST AND AFRICA WEARABLE CONFERENCING TECHNOLOGY MARKET: BY APPLICATION, 2021
FIGURE 21 MIDDLE EAST AND AFRICA WEARABLE CONFERENCING TECHNOLOGY MARKET: BY END USE, 2021
FIGURE 22 MIDDLE EAST & AFRICA WEARABLE CONFERENCING TECHNOLOGY MARKET: SNAPSHOT (2021)
FIGURE 23 MIDDLE EAST & AFRICA WEARABLE CONFERENCING TECHNOLOGY MARKET: BY COUNTRY (2021)
FIGURE 24 MIDDLE EAST & AFRICA WEARABLE CONFERENCING TECHNOLOGY MARKET: BY COUNTRY (2022 & 2029)
FIGURE 25 MIDDLE EAST & AFRICA WEARABLE CONFERENCING TECHNOLOGY MARKET: BY COUNTRY (2021 & 2029)
FIGURE 26 MIDDLE EAST & AFRICA WEARABLE CONFERENCING TECHNOLOGY MARKET: BY OFFERING (2022-2029)
FIGURE 27 MIDDLE EAST AND AFRICA WEARABLE CONFERENCING TECHNOLOGY MARKET: COMPANY SHARE 2021 (%)
Data collection and base year analysis are done using data collection modules with large sample sizes. The stage includes obtaining market information or related data through various sources and strategies. It includes examining and planning all the data acquired from the past in advance. It likewise envelops the examination of information inconsistencies seen across different information sources. The market data is analysed and estimated using market statistical and coherent models. Also, market share analysis and key trend analysis are the major success factors in the market report. To know more, please request an analyst call or drop down your inquiry.
The key research methodology used by DBMR research team is data triangulation which involves data mining, analysis of the impact of data variables on the market and primary (industry expert) validation. Data models include Vendor Positioning Grid, Market Time Line Analysis, Market Overview and Guide, Company Positioning Grid, Patent Analysis, Pricing Analysis, Company Market Share Analysis, Standards of Measurement, Global versus Regional and Vendor Share Analysis. To know more about the research methodology, drop in an inquiry to speak to our industry experts.
Data Bridge Market Research is a leader in advanced formative research. We take pride in servicing our existing and new customers with data and analysis that match and suits their goal. The report can be customized to include price trend analysis of target brands understanding the market for additional countries (ask for the list of countries), clinical trial results data, literature review, refurbished market and product base analysis. Market analysis of target competitors can be analyzed from technology-based analysis to market portfolio strategies. We can add as many competitors that you require data about in the format and data style you are looking for. Our team of analysts can also provide you data in crude raw excel files pivot tables (Fact book) or can assist you in creating presentations from the data sets available in the report.


