
North America Alternative Proteins Market
Market Size in USD Million
 USD
8.11 Million
USD
13.60 Million
2023
2031
USD
8.11 Million
USD
13.60 Million
2023
2031
| 2024 - 2031 | |
| USD 8.11 Million | |
| USD 13.60 Million | |
| % | |
|
North America Alternative Proteins Market Size
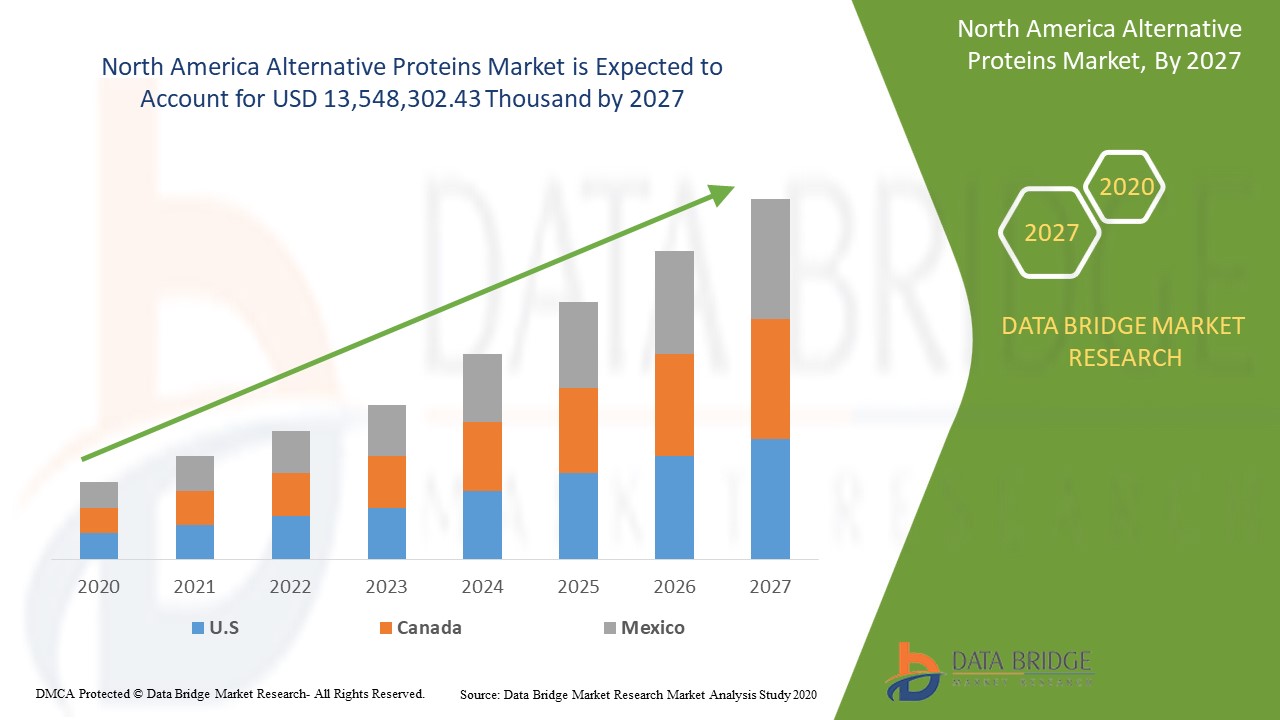
North America alternative proteins market size was valued at USD 8.11 million in 2023 and is projected to reach USD 13.6 million by 2031, with a CAGR of 13.6% during the forecast period of 2024 to 2031.
Report Scope and Market Segmentation
|
Attributes |
Alternative Proteins Key Market Insights |
|
Segmentation |
|
|
Countries Covered |
U.S., Canada and Mexico |
|
Key Market Players |
AgriProtein, Enterra Feed Corporation, Cargill, Incorporated, Axiom Foods, Inc, BENEO, NOW Foods, Roquette Frères, Farbest Brands, Parabel, ADM, DuPont, CHS Inc., Ingredion Incorporated, Kerry Group plc, EntomoFarms and Glanbia plc |
North America Alternative Proteins Market Dynamics
The rising demand for alternative proteins in wide industrial applications is accelerating the use of alternative proteins products which drives the alternative proteins market growth. Allergies associated with alternative proteins are acting as a restrain for the alternative proteins market in the above mentioned period.
The environmental effects of traditional meat production are dangerous and the alternative proteins production does not emit greenhouse gases and thus they do not cause any harm to the environment and hence it is an opportunity for alternative protein producers in the alternative proteins market in future. There are several risks associated with the consumption of insect protein which can act as a challenge for the alternative proteins market.
This alternative proteins market report provides details of market share, new developments, and product pipeline analysis, impact of domestic and localised market players, analyses opportunities in terms of emerging revenue pockets, changes in market regulations, product approvals, strategic decisions, product launches, geographic expansions, and technological innovations in the market. To understand the analysis and the alternative proteins market scenario contact Data Bridge Market Research for an Analyst Brief, our team will help you create a revenue impact solution to achieve your desired goal.
Alternative Proteins Market Scope
The alternative proteins market is segmented into four notable segments which are based on category, product type, form and application. The growth among segments helps you analyse niche pockets of growth and strategies to approach the market and determine your core application areas and the difference in your target markets.
Category
- Organic
- Inorganic
Product type
- Plant Protein
- Insect Protein
- Mycoprotein
- Cultured Meat
- Others
Form
- Dry
- liquid
Application
- Food and Beverages
- Animal Feed
- Pharmaceuticals
- Personal Care
- Cosmetics
- Others
North America Alternative Proteins Market Regional Analysis
North America alternative proteins market is analysed and market size information is provided by country, category, product type, form and application as referenced above.
The countries covered in the North America alternative proteins market are the U.S., Canada and Mexico.
The U.S. is expected to grow with the most promising growth rate in the North America alternative proteins market in the forecast period of 2024 to 2031 as the major industrialists are focusing to develop food and beverages products consisting alternative proteins which consumes wide range of kernels and processed form of alternative proteins for confectioneries, bakery and flavoured drinks in the food service sector.
The country section of the report also provides individual market impacting factors and changes in regulation in the market domestically that impacts the current and future trends of the market. Data points such as new sales, replacement sales, country demographics, regulatory acts and import-export tariffs are some of the major pointers used to forecast the market scenario for individual countries. Also, presence and availability of North America brands and their challenges faced due to large or scarce competition from local and domestic brands, impact of sales channels are considered while providing forecast analysis of the country data.
Alternative Proteins Market Share Analysis
Alternative proteins market competitive landscape provides details by competitor. Details included are company overview, company financials, revenue generated, market potential, investment in research and development, new market initiatives, North America presence, production sites and facilities, company strengths and weaknesses, product launch, product trials pipelines, product approvals, patents, product width and breadth, application dominance, technology lifeline curve. The above data points provided are only related to the companies’ focus related to North America alternative proteins market.
Alternative Proteins Market Leaders Operating in the Market Are:
- AgriProtein
- Enterra Feed Corporation
- Cargill, Incorporated
- Axiom Foods, Inc
- BENEO
- NOW Foods
- Roquette Frères
- Farbest Brands
- Parabel
- ADM
- DuPont
- CHS Inc.
- Ingredion Incorporated
- Kerry Group plc
- EntomoFarms
- Glanbia plc
Latest Developments in Alternative Proteins Market
- In August 2019, DuPont Nutrition & Biosciences (DuPont) received the Food Ingredients Innovation Award in the category of the “Most Innovative Ingredient of the Year” and attained the second place. This award is for the Danisco VEGE Cultures line. The product line was launched in February in South America and this has supported the fermented plant-based beverages and foods production. This award created a brand value of company in the plant-based alternatives market.
- In March 2016, Cargill, Incorporated has acquired the FPL Food, LLC. The company acquired the ground beef processing plant of FPL Food, LLC in Columbia. The acquisition has enhanced the ability of Cargill, Incorporated to serve foodservice and Eastern retail customers. This has helped the company to expand its protein business and it has ensured to better serve foodservice and retail customers where the demand for ground beef is high.
Partnership, joint ventures and other strategies enhances the company market share with increased coverage and presence. It also provides the benefit for organization to improve their offering for alternative proteins through expanded range of size.
SKU-

- Interactive Data Analysis Dashboard
- Company Analysis Dashboard for high growth potential opportunities
- Research Analyst Access for customization & queries
- Competitor Analysis with Interactive dashboard
- Latest News, Updates & Trend analysis
- Harness the Power of Benchmark Analysis for Comprehensive Competitor Tracking
North America Alternative Proteins Market, Supply Chain Analysis and Ecosystem Framework
To support market growth and help clients navigate the impact of geopolitical shifts, DBMR has integrated in-depth supply chain analysis into its North America Alternative Proteins Market research reports. This addition empowers clients to respond effectively to global changes affecting their industries. The supply chain analysis section includes detailed insights such as North America Alternative Proteins Market consumption and production by country, price trend analysis, the impact of tariffs and geopolitical developments, and import and export trends by country and HSN code. It also highlights major suppliers with data on production capacity and company profiles, as well as key importers and exporters. In addition to research, DBMR offers specialized supply chain consulting services backed by over a decade of experience, providing solutions like supplier discovery, supplier risk assessment, price trend analysis, impact evaluation of inflation and trade route changes, and comprehensive market trend analysis.
Data collection and base year analysis are done using data collection modules with large sample sizes. The stage includes obtaining market information or related data through various sources and strategies. It includes examining and planning all the data acquired from the past in advance. It likewise envelops the examination of information inconsistencies seen across different information sources. The market data is analysed and estimated using market statistical and coherent models. Also, market share analysis and key trend analysis are the major success factors in the market report. To know more, please request an analyst call or drop down your inquiry.
The key research methodology used by DBMR research team is data triangulation which involves data mining, analysis of the impact of data variables on the market and primary (industry expert) validation. Data models include Vendor Positioning Grid, Market Time Line Analysis, Market Overview and Guide, Company Positioning Grid, Patent Analysis, Pricing Analysis, Company Market Share Analysis, Standards of Measurement, Global versus Regional and Vendor Share Analysis. To know more about the research methodology, drop in an inquiry to speak to our industry experts.
Data Bridge Market Research is a leader in advanced formative research. We take pride in servicing our existing and new customers with data and analysis that match and suits their goal. The report can be customized to include price trend analysis of target brands understanding the market for additional countries (ask for the list of countries), clinical trial results data, literature review, refurbished market and product base analysis. Market analysis of target competitors can be analyzed from technology-based analysis to market portfolio strategies. We can add as many competitors that you require data about in the format and data style you are looking for. Our team of analysts can also provide you data in crude raw excel files pivot tables (Fact book) or can assist you in creating presentations from the data sets available in the report.


