
Global Camel Dairy Market
Market Size in USD Billion
 USD
6.64 Billion
USD
13.24 Billion
2022
2030
USD
6.64 Billion
USD
13.24 Billion
2022
2030
| 2023 - 2030 | |
| USD 6.64 Billion | |
| USD 13.24 Billion | |
| % | |
|
Camel Dairy Market Analysis and Size
As per the report of U.S. Food and Drug Administration, camel milk approximately contains 3 percent fat. However, it is analyzed that the proportion of fat content in camel milk differs from region to region. Moreover, according to medical research, camel milk has shown positive impact on autistic children to live a better life. Also, manufacturers of camel dairy products are also diversifying the flavors and range of their dairy products during the forecast period.
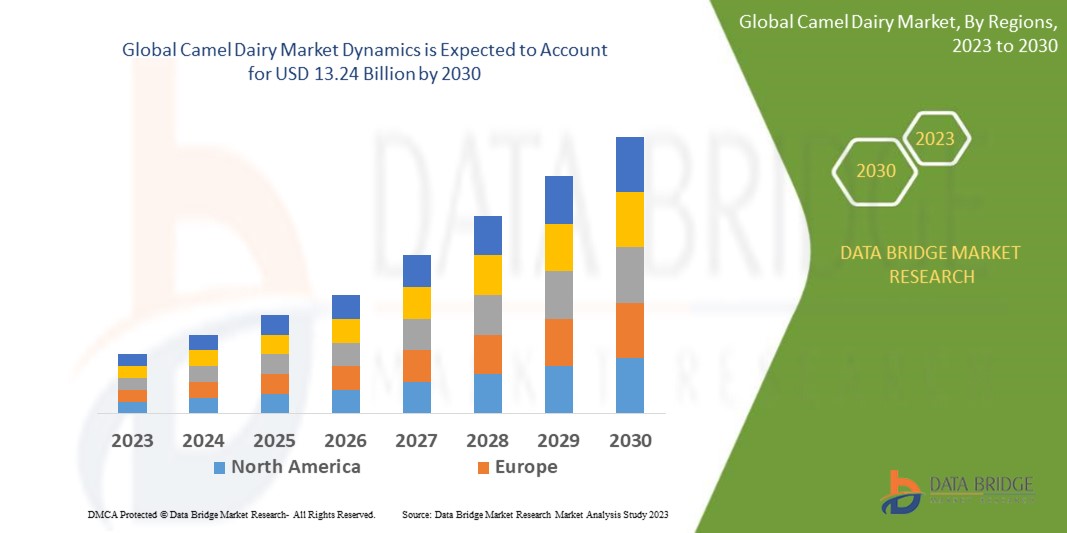
Data Bridge Market Research analyses that the camel dairy market is expected to reach USD 13.24 billion by 2030, which is USD 6.64 billion in 2022, registering a CAGR of 9.00% during the forecast period of 2023 to 2030. In addition to the insights on market scenarios such as market value, growth rate, segmentation, geographical coverage, and major players, the market reports curated by the Data Bridge Market Research also include in-depth expert analysis, geographically represented company-wise production and capacity, network layouts of distributors and partners, detailed and updated price trend analysis and deficit analysis of supply chain and demand.
Camel Dairy Market Scope and Segmentation
|
Report Metric |
Details |
|
Forecast Period |
2023 to 2030 |
|
Base Year |
2022 |
|
Historic Years |
2021 (Customizable to 2015 - 2020) |
|
Quantitative Units |
Revenue in USD Billion, Volumes in Units, Pricing in USD |
|
Segments Covered |
Product Type (Raw Milk, Pasteurized Milk, Flavoured Milk, Cheese, Yogurt, Laban, Ghee, Ice Cream, Powder, Infant Formula, Others), Distribution Channel (Supermarkets and Hypermarkets, Convenience Stores, Speciality Stores, Online Stores, Others), Packaging Type (Cartons, Bottles, Cans, Jars, Others), End-User (Baby, Elder, Adult) |
|
Countries Covered |
U.S., Canada, Mexico in North America, Germany, Sweden, Poland, Denmark, Italy, U.K., France, Spain, Netherlands, Belgium, Switzerland, Turkey, Russia, Rest of Europe in Europe, Japan, China, India, South Korea, New Zealand, Vietnam, Australia, Singapore, Malaysia, Thailand, Indonesia, Philippines, Rest of Asia-Pacific (APAC) in Asia-Pacific (APAC), Brazil, Argentina, Rest of South America as a part of South America, UAE, Saudi Arabia, Oman, Qatar, Kuwait, South Africa, Rest of Middle East and Africa (MEA) as a part of Middle East and Africa (MEA) |
|
Market Players Covered |
Lokhit Pashu Palak Sansthan (LPPS) (India), Aadvik Foods and Products Pvt. Ltd. (India), Emirates Industry for Camel Milk & Products (EICMP) (UAE), QCamel (Australia), The Camel Milk Co. Australia Pty Ltd. (Australia), Desert Farms Inc. (Saudi Arabia), VITAL CAMEL MILK LTD (U.S.), UK Camel Milk Ltd (U.K.), Camilk Dairy (Australia), Dandaragan Camel Dairies Pty Ltd (Australia), The Good Earth Dairy (Australia), DromeDairy Naturals (U.S.), Al Ain Farms (UAE), Camelicious (Dubai), Camel Milk South Africa (South Africa), Camel Dairy Smits (Netherlands) |
|
Market Opportunities |
|
Market Definition
The milk of camel and other dairy products are gaining huge popularity owing to their various health benefits. Camel dairy products are very helpful for improving lipid content and reducing insulin resistance in the human body. Camel’s milk contains a large proportion of vitamin C and iron compared to normal milk; it also has lower cholesterol and fat value.
Camel Dairy Market Dynamics
Drivers
- Rising prevalence of lactose and autism intolerance
Camel dairy products contain numerous times more vitamin C and iron content than cow dairy product. Furthermore, Camel dairy products are lower in cholesterol, protein and fat content. According to medical survey, Camel dairy products can help autistic children to live a better life. Individuals with lactose intolerance feel much better by consuming camel dairy products than cow dairy. As a result of these factors, camel dairy products have been slowly gaining popularity all around the globe during the forecast period.
- Growing adoption of raw camel milk among children
As per the research which has conducted by National Research Centre on Camel, in 2021 it has been observed that an overall enhancement from pre to post-treatment scores was 30.22% in all mentally retarded and autistic children. The children with pre-treatment scores up to 75 have shown enhancement of 43 to 58% and those with pre-treatment scores of 90 have shown enhancement of up to 34%. Several scientific studies have proven camel milk's benefits in diseases such as autism, arthritis and diabetes due to its rich protein, vitamin, and anti-oxidant properties. Thus, increasing adoption of raw camel milk among children is anticipated to drive the market growth.
Opportunities
- Growing public awareness regarding health benefits
Growing awareness regarding health benefits of camel dairy products among consumer, such as their high calcium, protein and other nutrient content is the major reason which will expected to generate immense and ample opportunities for the market growth. Nowadays, cholesterol and obesity are becoming more prevalent in people owing to changes in eating habits and hectic lifestyle globally. Consumers are becoming more conscious regarding their health, which is increasing the demand for camel dairy products.
Restraints/ Challenges
- High cost of camel dairy products
Camel dairy products are comparatively more expensive as compared to traditional cattle dairy products because of high production expenses associated with these products. For instance, The cost of camel milk is USD 13 per liter, while, the costs of cow milk around USD 0.40 per liter In Europe. Also, In U.S Desert Farms delivers USD 35 per liter, while the price of cow milk about USD 0.80 per liter. The high cost of camel dairy products is likely to obstruct the market growth during the forecast period.
This camel dairy market report provides details of new recent developments, trade regulations, import-export analysis, production analysis, value chain optimization, market share, impact of domestic and localized market players, analyses opportunities in terms of emerging revenue pockets, changes in market regulations, strategic market growth analysis, market size, category market growth application niches and dominance, product approvals, product launches, geographic expansions, technological innovations in the market. To gain more info on the camel dairy market contact Data Bridge Market Research for an Analyst Brief, our team will help you take an informed market decision to achieve market growth.
Impact and Current Market Scenario of Raw Material Shortage and Shipping Delays
Data Bridge Market Research offers a high-level analysis of the market and delivers information by keeping in account the impact and current market environment of raw material shortage and shipping delays. This translates into assessing strategic possibilities, creating effective action plans, and assisting businesses in making important decisions.
Apart from the standard report, we also offer in-depth analysis of the procurement level from forecasted shipping delays, distributor mapping by region, commodity analysis, production analysis, price mapping trends, sourcing, category performance analysis, supply chain risk management solutions, advanced benchmarking, and other services for procurement and strategic support.
Expected Impact of Economic Slowdown on the Pricing and Availability of Products
When economic activity slows, industries begin to suffer. The forecasted effects of the economic downturn on the pricing and accessibility of the products are taken into account in the market insight reports and intelligence services provided by DBMR. With this, our clients can typically keep one step ahead of their competitors, project their sales and revenue, and estimate their profit and loss expenditures.
Global Camel Dairy Market Scope
The camel dairy market is segmented on the basis of product type, distribution channel, packaging type and end-user. The growth amongst these segments will help you analyze meagre growth segments in the industries and provide the users with a valuable market overview and market insights to help them make strategic decisions for identifying core market applications.
Product Type
- Yogurt
- Raw Milk
- Pasteurized Milk
- Flavoured Milk
- Cheese
- Laban
- Ghee
- Ice Cream
- Powder
- Infant Formula
- Others
Distribution Channel
- Supermarkets and Hypermarkets
- Convenience Stores
- Speciality Stores
- Online Stores
- Others
Packaging Type
- Cartons
- Bottles
- Cans
- Jars
- Others
End Users
- Baby
- Elder
- Adult
Camel Dairy Market Regional Analysis/Insights
The camel dairy market is analyzed and market size insights and trends are provided by country, product type, distribution channel, packaging type and end-user as referenced above.
The countries covered in the camel dairy market report are U.S., Canada, Mexico in North America, Germany, Sweden, Poland, Denmark, Italy, U.K., France, Spain, Netherlands, Belgium, Switzerland, Turkey, Russia, Rest of Europe in Europe, Japan, China, India, South Korea, New Zealand, Vietnam, Australia, Singapore, Malaysia, Thailand, Indonesia, Philippines, Rest of Asia-Pacific (APAC) in Asia-Pacific (APAC), Brazil, Argentina, Rest of South America as a part of South America, UAE, Saudi Arabia, Oman, Qatar, Kuwait, South Africa, Rest of Middle East and Africa (MEA) as a part of Middle East and Africa (MEA).
Middle East and Africa (MEA) dominates the camel dairy market in terms of revenue share and market share. This is mainly due to increased production and consumption rates of camel dairy products in this region.
North America is expected to be the fastest developing region during the forecast period of 2023-2030 owing to surge in the adoption of camel dairy products by those consumer which are suffering from diabetes in this region.
The country section of the report also provides individual market impacting factors and changes in market regulation that impact the current and future trends of the market. Data points like down-stream and upstream value chain analysis, technical trends and porter's five forces analysis, case studies are some of the pointers used to forecast the market scenario for individual countries. Also, the presence and availability of global brands and their challenges faced due to large or scarce competition from local and domestic brands, impact of domestic tariffs and trade routes are considered while providing forecast analysis of the country data.
Competitive Landscape and Camel Dairy Market Share Analysis
The camel dairy market competitive landscape provides details by competitor. Details included are company overview, company financials, revenue generated, market potential, investment in research and development, new market initiatives, global presence, production sites and facilities, production capacities, company strengths and weaknesses, product launch, product width and breadth, application dominance. The above data points provided are only related to the companies' focus related to camel dairy market.
Some of the major players operating in the camel dairy market are:
- Lokhit Pashu Palak Sansthan (LPPS) (India)
- Aadvik Foods and Products Pvt. Ltd. (India)
- Emirates Industry for Camel Milk & Products (EICMP) (UAE)
- QCamel (Australia)
- The Camel Milk Co. Australia Pty Ltd. (Australia)
- Desert Farms Inc. (Saudi Arabia)
- VITAL CAMEL MILK LTD (U.S.)
- UK Camel Milk Ltd (U.K.)
- Camilk Dairy (Australia)
- Dandaragan Camel Dairies Pty Ltd (Australia)
- The Good Earth Dairy (Australia)
- DromeDairy Naturals (U.S.)
- Al Ain Farms (UAE)
- Camelicious (Dubai)
- Camel Milk South Africa (South Africa)
- Camel Dairy Smits (Netherlands)
SKU-

- Interactive Data Analysis Dashboard
- Company Analysis Dashboard for high growth potential opportunities
- Research Analyst Access for customization & queries
- Competitor Analysis with Interactive dashboard
- Latest News, Updates & Trend analysis
- Harness the Power of Benchmark Analysis for Comprehensive Competitor Tracking
Table of Content
1 INTRODUCTION
1.1 OBJECTIVES OF THE STUDY
1.2 MARKET DEFINITION
1.3 OVERVIEW OF GLOBAL CAMEL DAIRY MARKET
1.4 CURRENCY AND PRICING
1.5 LIMITATION
1.6 MARKETS COVERED
2 MARKET SEGMENTATION
2.1 MARKETS COVERED
2.2 ARRIVING AT THE GLOBAL CAMEL DAIRY MARKET
2.3 VENDOR POSITIONING GRID
2.4 TECHNOLOGY LIFE LINE CURVE
2.5 MARKET GUIDE
2.6 COMPANY POSITIONING GRID
2.7 COMAPANY MARKET SHARE ANALYSIS
2.8 MULTIVARIATE MODELLING
2.9 DEMAND AND SUPPLY-SIDE VARIABLES
2.1 CONSUMPTION TREND OF END PRODUCTS
2.11 TOP TO BOTTOM ANALYSIS
2.12 STANDARDS OF MEASUREMENT
2.13 VENDOR SHARE ANALYSIS
2.14 DATA POINTS FROM KEY PRIMARY INTERVIEWS
2.15 DATA POINTS FROM KEY SECONDARY DATABASES
2.16 GLOBAL CAMEL DAIRY MARKET : RESEARCH SNAPSHOT
2.17 ASSUMPTIONS
3 MARKET OVERVIEW
3.1 DRIVERS
3.2 RESTRAINTS
3.3 OPPORTUNITIES
3.4 CHALLENGES
4 EXECUTIVE SUMMARY
5 PREMIUM INSIGHTS
5.1 SUPPLY CHAIN ANALYSIS
5.2 FACTORS INFLUENCING PURCHASING DECISION
5.3 INDUTRY TRENDS AND FUTURE PERSPECTIVES
5.4 SHOPPING BEHAVIOUR AND DYNAMICS
5.4.1 RECOMMENDATION FROM FAMILY & FRIENDS
5.4.2 RESEARCH
5.4.3 IMPULSIVE
5.4.4 ADVERTISEMENT
5.4.4.1. TELEVISION ADVERTISEMENT
5.4.4.2. ONLINE ADVERTISEMENT
5.4.4.3. IN-STORE ADVERTISEMENT
5.4.4.4. OUTDOOR ADVERTISEMENT
5.5 PROMOTIONAL ACTIVITIES
5.6 CONSUMER DISPOSABLE INCOME DYNAMICS/SPEND DYNAMICS
5.7 NEW PRODUCT LAUNCH STRATEGY
5.7.1 NUMBER OF NEW PRODUCT LAUNCH
5.7.1.1. LINE EXTENSTION
5.7.1.2. NEW PACKAGING
5.7.1.3. RE-LAUNCHED
5.7.1.4. NEW FORMULATION
5.7.2 DIFFERNTIAL PRODUCT OFFERING
5.7.3 PACKAGE DESIGNING
5.7.4 PRICING ANALYSIS
5.8 CONSUMER LEVEL TRENDS
6 IMPACT OF ECONOMIC SLOW DOWN ON MARKET
6.1 IMPACT ON PRICE
6.2 IMPACT ON SUPPLY CHAIN
6.3 IMPACT ON SHIPMENT
6.4 IMPACT ON COMPANY’S STRATEGIC DECISIONS
7 REGULATORY FRAMEWORK AND GUIDELINES
8 GLOBAL CAMEL DAIRY MARKET, BY PRODUCT, 2021-2030, (USD MILLION),
8.1 OVERVIEW
8.2 PLAIN MILK
8.3 FLAVORED MILK
8.4 POWDER
8.5 FERMENTED
8.6 YOGURT
8.7 CHEESE
8.8 INFANT FORMULA
8.9 LABAN
8.1 GHEE
8.11 OTHERS
9 GLOBAL CAMEL DAIRY MARKET, BY PRODUCT TYPE, 2021-2030, (USD MILLION),
9.1 OVERVIEW
9.2 FRESH
9.3 FROZEN
9.4 FREEZE-DRIED
10 GLOBAL CAMEL DAIRY MARKET, BY PACKAGING TYPE, 2021-2030, (USD MILLION)
10.1 OVERVIEW
10.2 CARTONS
10.3 JARS
10.4 CANS
10.5 BOTTLES
10.6 OTHERS
11 GLOBAL CAMEL DAIRY MARKET, BY DISTRIBUTION CHANNEL, 2021-2030, (USD MILLION)
11.1 OVERVIEW
11.2 SUPERMARKETS/HYPERMARKETS
11.3 ONLINE CHANNELS
11.4 CONVENIENCE STORES
11.5 OTHERS
12 GLOBAL CAMEL DAIRY MARKET, BY END-USE, 2021-2030, (USD MILLION)
12.1 OVERVIEW
12.2 BABY
12.3 ELDER
12.4 ADULT
13 GLOBAL CAMEL DAIRY MARKET, BY REGION, (2021-2030), (USD MILLION) (TONS)
GLOBAL CAMEL DAIRY MARKET, (ALL SEGMENTATION PROVIDED ABOVE IS REPRESENTED IN THIS CHAPTER BY COUNTRY)
13.1 NORTH AMERICA
13.1.1 U.S.
13.1.2 CANADA
13.1.3 MEXICO
13.2 EUROPE
13.2.1 ERMANY
13.2.2 U.K.
13.2.3 ITALY
13.2.4 FRANCE
13.2.5 SPAIN
13.2.6 RUSSIA
13.2.7 SWITZERLAND
13.2.8 TURKEY
13.2.9 BELGIUM
13.2.10 NETHERLANDS
13.2.11 DENMARK
13.2.12 SWEDEN
13.2.13 POLAND
13.2.14 NORWAY
13.2.15 FINLAND
13.2.16 REST OF EUROPE
13.3 ASIA-PACIFIC
13.3.1 JAPAN
13.3.2 CHINA
13.3.3 SOUTH KOREA
13.3.4 INDIA
13.3.5 SINGAPORE
13.3.6 THAILAND
13.3.7 INDONESIA
13.3.8 MALAYSIA
13.3.9 PHILIPPINES
13.3.10 AUSTRALIA
13.3.11 NEW ZEALAND
13.3.12 VIETNAM
13.3.13 TAIWAN
13.3.14 REST OF ASIA-PACIFIC
13.4 SOUTH AMERICA
13.4.1 BRAZIL
13.4.2 ARGENTINA
13.4.3 REST OF SOUTH AMERICA
13.5 MIDDLE EAST AND AFRICA
13.5.1 SOUTH AFRICA
13.5.2 EGYPT
13.5.3 BAHRAIN
13.5.4 UNITED ARAB EMIRATES
13.5.5 KUWAIT
13.5.6 OMAN
13.5.7 QATAR
13.5.8 SAUDI ARABIA
13.5.9 REST OF MEA
14 GLOBAL CAMEL DAIRY MARKET, COMPANY LANDSCAPE
14.1 COMPANY SHARE ANALYSIS: GLOBAL
14.2 COMPANY SHARE ANALYSIS: NORTH AMERICA
14.3 COMPANY SHARE ANALYSIS: EUROPE
14.4 COMPANY SHARE ANALYSIS: ASIA-PACIFIC
14.5 MERGERS AND ACQUISITIONS
14.6 NEW PRODUCT DEVELOPMENT AND APPROVALS
14.7 EXPANSIONS
14.8 PARTNERSHIP AND OTHER STRATEGIC DEVELOPMENTS
15 GLOBAL CAMEL DAIRY MARKET, SWOT AND DBMR ANALYSIS
16 GLOBAL CAMEL DAIRY MARKET , COMPANY PROFILE
16.1 CAMEL CHARISMA PVT. LTD.
16.1.1 COMPANY OVERVIEW
16.1.2 REVENUE ANALYSIS
16.1.3 PRODUCT PORTFOLIO
16.1.4 GEOGRAPHIC PRESENCE
16.1.5 RECENT DEVELOPMENTS
16.2 AADVIK FOODS
16.2.1 COMPANY OVERVIEW
16.2.2 REVENUE ANALYSIS
16.2.3 PRODUCT PORTFOLIO
16.2.4 GEOGRAPHIC PRESENCE
16.2.5 RECENT DEVELOPMENTS
16.3 GCMMF
16.3.1 COMPANY OVERVIEW
16.3.2 REVENUE ANALYSIS
16.3.3 PRODUCT PORTFOLIO
16.3.4 GEOGRAPHIC PRESENCE
16.3.5 RECENT DEVELOPMENTS
16.4 NR FOOD PRODUCTS
16.4.1 COMPANY OVERVIEW
16.4.2 REVENUE ANALYSIS
16.4.3 PRODUCT PORTFOLIO
16.4.4 GEOGRAPHIC PRESENCE
16.4.5 RECENT DEVELOPMENTS
16.5 AUMSVASTI
16.5.1 COMPANY OVERVIEW
16.5.2 REVENUE ANALYSIS
16.5.3 PRODUCT PORTFOLIO
16.5.4 GEOGRAPHIC PRESENCE
16.5.5 RECENT DEVELOPMENTS
16.6 DEEPANSHI INDIA
16.6.1 COMPANY OVERVIEW
16.6.2 REVENUE ANALYSIS
16.6.3 PRODUCT PORTFOLIO
16.6.4 GEOGRAPHIC PRESENCE
16.6.5 RECENT DEVELOPMENTS
16.7 CAMELICIOUS
16.7.1 COMPANY OVERVIEW
16.7.2 REVENUE ANALYSIS
16.7.3 PRODUCT PORTFOLIO
16.7.4 GEOGRAPHIC PRESENCE
16.7.5 RECENT DEVELOPMENTS
16.8 AL AIN FARMS
16.8.1 COMPANY OVERVIEW
16.8.2 REVENUE ANALYSIS
16.8.3 PRODUCT PORTFOLIO
16.8.4 GEOGRAPHIC PRESENCE
16.8.5 RECENT DEVELOPMENTS
16.9 DESERT FARMS, INC
16.9.1 COMPANY OVERVIEW
16.9.2 REVENUE ANALYSIS
16.9.3 PRODUCT PORTFOLIO
16.9.4 GEOGRAPHIC PRESENCE
16.9.5 RECENT DEVELOPMENTS
16.1 TIVISKI DAIRY
16.10.1 COMPANY OVERVIEW
16.10.2 REVENUE ANALYSIS
16.10.3 PRODUCT PORTFOLIO
16.10.4 GEOGRAPHIC PRESENCE
16.10.5 RECENT DEVELOPMENTS
16.11 CAMILK LTD
16.11.1 COMPANY OVERVIEW
16.11.2 REVENUE ANALYSIS
16.11.3 PRODUCT PORTFOLIO
16.11.4 GEOGRAPHIC PRESENCE
16.11.5 RECENT DEVELOPMENTS
16.12 CAMEL DAIRY SMITS
16.12.1 COMPANY OVERVIEW
16.12.2 REVENUE ANALYSIS
16.12.3 PRODUCT PORTFOLIO
16.12.4 GEOGRAPHIC PRESENCE
16.12.5 RECENT DEVELOPMENTS
16.13 THE CAMEL MILK CO. AUSTRALIA PTY LTD.
16.13.1 COMPANY OVERVIEW
16.13.2 REVENUE ANALYSIS
16.13.3 PRODUCT PORTFOLIO
16.13.4 GEOGRAPHIC PRESENCE
16.13.5 RECENT DEVELOPMENTS
16.14 CAMEL MILK SOUTH AFRICA
16.14.1 COMPANY OVERVIEW
16.14.2 REVENUE ANALYSIS
16.14.3 PRODUCT PORTFOLIO
16.14.4 GEOGRAPHIC PRESENCE
16.14.5 DEVELOPMENTS
NOTE: THE COMPANIES PROFILED IS NOT EXHAUSTIVE LIST AND IS AS PER OUR PREVIOUS CLIENT REQUIREMENT. WE PROFILE MORE THAN 100 COMPANIES IN OUR STUDY AND HENCE THE LIST OF COMPANIES CAN BE MODIFIED OR REPLACED ON REQUEST
17 CONCLUSION
18 REFERENCE
19 QUESTIONNAIRE
20 RELATED REPORTS
21 ABOUT DATA BRIDGE MARKET RESEARCH
Global Camel Dairy Market, Supply Chain Analysis and Ecosystem Framework
To support market growth and help clients navigate the impact of geopolitical shifts, DBMR has integrated in-depth supply chain analysis into its Global Camel Dairy Market research reports. This addition empowers clients to respond effectively to global changes affecting their industries. The supply chain analysis section includes detailed insights such as Global Camel Dairy Market consumption and production by country, price trend analysis, the impact of tariffs and geopolitical developments, and import and export trends by country and HSN code. It also highlights major suppliers with data on production capacity and company profiles, as well as key importers and exporters. In addition to research, DBMR offers specialized supply chain consulting services backed by over a decade of experience, providing solutions like supplier discovery, supplier risk assessment, price trend analysis, impact evaluation of inflation and trade route changes, and comprehensive market trend analysis.
Data collection and base year analysis are done using data collection modules with large sample sizes. The stage includes obtaining market information or related data through various sources and strategies. It includes examining and planning all the data acquired from the past in advance. It likewise envelops the examination of information inconsistencies seen across different information sources. The market data is analysed and estimated using market statistical and coherent models. Also, market share analysis and key trend analysis are the major success factors in the market report. To know more, please request an analyst call or drop down your inquiry.
The key research methodology used by DBMR research team is data triangulation which involves data mining, analysis of the impact of data variables on the market and primary (industry expert) validation. Data models include Vendor Positioning Grid, Market Time Line Analysis, Market Overview and Guide, Company Positioning Grid, Patent Analysis, Pricing Analysis, Company Market Share Analysis, Standards of Measurement, Global versus Regional and Vendor Share Analysis. To know more about the research methodology, drop in an inquiry to speak to our industry experts.
Data Bridge Market Research is a leader in advanced formative research. We take pride in servicing our existing and new customers with data and analysis that match and suits their goal. The report can be customized to include price trend analysis of target brands understanding the market for additional countries (ask for the list of countries), clinical trial results data, literature review, refurbished market and product base analysis. Market analysis of target competitors can be analyzed from technology-based analysis to market portfolio strategies. We can add as many competitors that you require data about in the format and data style you are looking for. Our team of analysts can also provide you data in crude raw excel files pivot tables (Fact book) or can assist you in creating presentations from the data sets available in the report.


