
North America Digital Experience Platform Market
Market Size in USD Billion
 USD
19.78 Billion
USD
75.34 Billion
2025
2033
USD
19.78 Billion
USD
75.34 Billion
2025
2033
| 2026 - 2033 | |
| USD 19.78 Billion | |
| USD 75.34 Billion | |
| % | |
|
North America Digital Experience Platform Market Overview
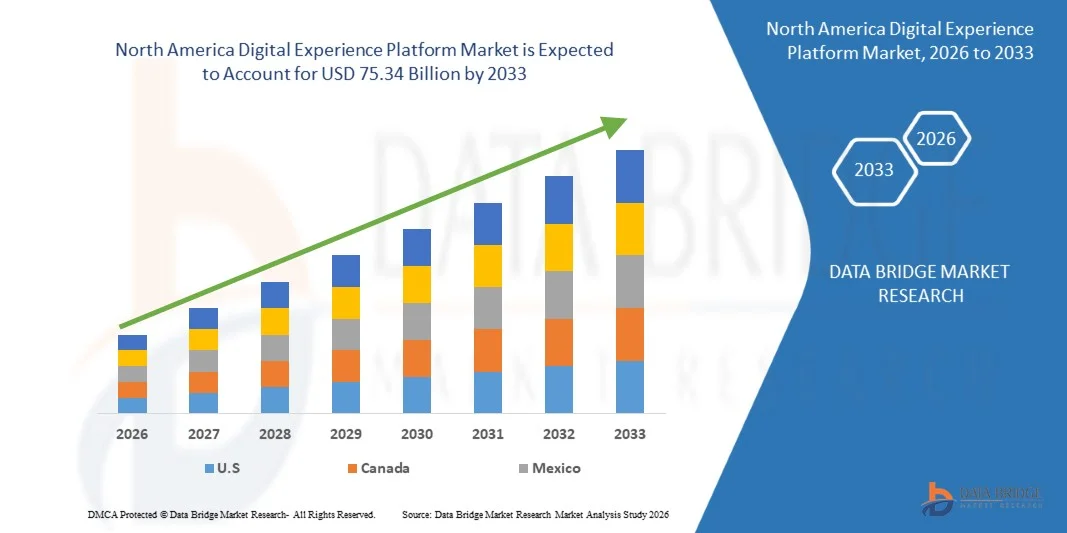
As per Data Bridge Market Research analysis the North America digital experience platform market was valued at USD 19.78 billion in 2025 and is projected to reach USD 75.34 billion by 2033, growing at a CAGR of 18.20% from 2026 to 2033. The market is witnessing steady expansion driven by the growing need for unified customer engagement, increasing adoption of cloud-based solutions, and rising demand for personalized digital experiences across multiple touchpoints such as web, mobile, and social media.
The rapid shift toward digital transformation across enterprises, coupled with increasing competition to deliver seamless and consistent customer journeys, is significantly boosting the adoption of digital experience platforms. Organizations are integrating AI-driven analytics, content management systems, and customer data platforms to enhance real-time personalization and improve user engagement. In addition, the expansion of e-commerce, omnichannel marketing strategies, and growing investments in customer experience optimization are further accelerating market growth across industries such as retail, BFSI, healthcare, and IT services.
Key Market Trends & Insights
- The U.S. dominated the North America digital experience platform market with the largest revenue share of 42.6% in 2025, supported by strong presence of leading technology providers, high digital maturity of enterprises, and widespread adoption of cloud-based customer experience platforms integrated with AI and analytics capabilities.
- Canada is expected to be the fastest-growing country in the North America digital experience platform market, recording a CAGR of 12.9% from 2026 to 2033. Growth is driven by increasing cloud adoption, rising investments in digital transformation initiatives, and growing focus on enhancing customer experience across SMEs and large enterprises.
- The Platform segment held the largest market revenue share of approximately 58.6% in 2025 driven by increasing demand for integrated content management, customer data platforms, and AI-powered personalization engines. Enterprises are widely adopting unified platforms to streamline customer journey orchestration, improve engagement, and enable real-time analytics across multiple digital touchpoints such as web, mobile, and connected applications.
- The Services segment is projected to register the fastest growth at a CAGR of 12.4% from 2026 to 2033, driven by rising demand for implementation, integration, consulting, and managed services. Increasing complexity of digital transformation initiatives and growing need for continuous platform optimization are accelerating service adoption across large enterprises and mid-sized organizations.
- The Cloud segment held the largest market revenue share of approximately 71.2% in 2025 driven by rapid enterprise migration toward scalable, flexible, and cost-efficient digital infrastructure. Cloud-based platforms enable faster deployment, seamless updates, and improved omnichannel content delivery, making them the preferred choice for modern digital experience strategies.
- The On Premises segment is projected to register a CAGR of 7.9% from 2026 to 2033, supported by demand from highly regulated industries such as BFSI and healthcare that require greater control over data security, compliance, and system customization. Despite slower adoption, legacy infrastructure dependencies continue to sustain this segment in large enterprises.
- The Large Enterprise segment held the largest market revenue share of approximately 66.3% in 2025 driven by high digital transformation budgets, complex customer ecosystems, and strong adoption of AI-driven personalization technologies. Large enterprises are increasingly deploying integrated platforms to manage high-volume customer interactions and enhance omnichannel engagement strategies.
- The Small & Medium Enterprise segment is projected to register the fastest growth at a CAGR of 13.6% from 2026 to 2033, driven by increasing availability of affordable cloud-based solutions and growing awareness of customer experience optimization. SMEs are rapidly adopting subscription-based digital experience platforms to improve competitiveness and expand digital reach.
- The Business to Customer segment held the largest market revenue share of approximately 61.9% in 2025 driven by strong adoption across retail, e-commerce, media, and financial services industries. Increasing demand for personalized customer journeys, real-time engagement, and omnichannel communication is significantly boosting B2C platform deployment.
- The Business to Business segment is projected to register a CAGR of 11.5% from 2026 to 2033, driven by increasing digitalization of enterprise sales processes, rising demand for account-based marketing, and growing use of digital platforms for partner ecosystem management and client engagement.
- The Retail segment held the largest market revenue share of approximately 24.7% in 2025 driven by rapid expansion of e-commerce, increasing omnichannel retail strategies, and strong demand for personalized shopping experiences across digital channels.
- The BFSI segment is projected to register the fastest growth at a CAGR of 13.1% from 2026 to 2033, driven by increasing adoption of digital banking platforms, mobile-first customer engagement strategies, and AI-based personalization for financial services. Growing emphasis on customer experience optimization and regulatory-driven digital transformation is further accelerating adoption across the sector.
Market Size & Forecast
- Market Value (2025): USD 19.78 Billion
- Expected Market Value (2033): USD 75.34 Billion
- Forecast CAGR (2026–2033): 18.20%
- Leading Country in 2025: U.S.
- Fastest Growing Country: Canada
Report Scope and North America Digital Experience Platform Market Segmentation
|
Attributes |
North America Digital Experience Platform Key Market Insights |
|
Segments Covered |
|
|
Countries Covered |
North America
|
|
Key Market Players |
• Adobe (U.S.) |
|
Market Opportunities |
|
|
Value Added Data Infosets |
In addition to the market insights such as market value, growth rate, market segments, geographical coverage, market players, and market scenario, the market report curated by the Data Bridge Market Research team includes in-depth expert analysis, import/export analysis, pricing analysis, production consumption analysis, and pestle analysis. |
North America Digital Experience Platform Market Trends
Trend: Rapid Adoption Of AI-Driven Personalization And Omnichannel Customer Engagement In Digital Experience Platforms
The increasing demand for seamless, consistent, and highly personalized customer experiences across web, mobile, social media, and connected devices is accelerating the adoption of digital experience platforms across global enterprises. Organizations are shifting away from fragmented content management systems toward unified platforms that integrate content, commerce, analytics, and customer data into a single ecosystem. This transformation is being driven by rising digital consumption, growing competition in online markets, and increasing customer expectations for real-time personalization and frictionless interactions.
In modern enterprise environments, companies are embedding artificial intelligence and machine learning capabilities into digital experience platforms to enable predictive personalization, automated content delivery, and real-time customer journey optimization. For instance, AI-powered recommendation engines are being widely used in e-commerce and media platforms to analyze user behavior and improve engagement rates, with industry implementations reporting engagement improvements of nearly 20–30% after adopting personalized content delivery systems.
The expansion of omnichannel commerce is also reshaping platform deployment strategies, with businesses integrating websites, mobile applications, in-store digital systems, and social commerce channels into unified customer experience ecosystems. In addition, increasing adoption of headless and composable architecture is enabling enterprises to deliver content faster across multiple digital endpoints while maintaining scalability and flexibility. Real-world enterprise deployments in 2025 have shown that organizations implementing composable digital experience platforms achieved up to 25% faster content deployment cycles compared to traditional monolithic systems.
Global Digital Experience Platform Market Dynamics
Key Market Driver: Rising Demand For Unified And Personalized Customer Experience Ecosystems
Enterprises across retail, BFSI, healthcare, and media sectors are increasingly focusing on delivering consistent and personalized customer experiences across all digital touchpoints to improve engagement, retention, and conversion rates. The fragmentation of customer data across multiple systems has created strong demand for integrated platforms that unify content management, customer data, and analytics into a single operational framework.
Organizations are increasingly deploying digital experience platforms to centralize customer insights and deliver real-time personalization across websites, mobile applications, and digital kiosks. For instance, global retail and e-commerce companies are leveraging AI-powered customer journey analytics to optimize product recommendations and improve conversion performance, with some implementations reporting conversion rate improvements of approximately 15–25% after adopting unified digital experience solutions.
Similarly, financial institutions are using digital experience platforms to enhance customer onboarding, personalize banking interfaces, and streamline digital service delivery across multiple channels. The rapid growth of subscription-based digital services and increasing demand for seamless omnichannel engagement are further reinforcing the need for scalable and cloud-based digital experience infrastructures.
Key Restraint/Challenge: High Implementation Complexity And Integration Costs Across Legacy Systems
Despite strong adoption trends, the deployment of digital experience platforms remains challenged by high implementation complexity, particularly in organizations with legacy IT infrastructure and fragmented data ecosystems. Integrating multiple systems such as customer relationship management, content management, and analytics platforms often requires significant customization, increasing both deployment time and operational costs.
In addition, ongoing subscription costs, infrastructure requirements, and skilled workforce shortages in AI, data engineering, and platform management create financial and operational barriers for small and mid-sized enterprises. The complexity of migrating large volumes of legacy customer data into unified platforms also increases the risk of data inconsistency and integration delays.
Industry assessments indicate that large-scale digital transformation projects involving digital experience platforms can require implementation timelines of 6–18 months depending on organizational size and system complexity, with integration costs representing a significant portion of total digital transformation budgets in enterprise environments
Key Market Opportunity: Expansion Of Cloud-Based Composable And Headless Digital Experience Architectures
The rapid shift toward cloud computing and API-driven architectures is creating significant opportunities for composable and headless digital experience platforms that enable faster deployment, greater flexibility, and improved scalability. Enterprises are increasingly adopting modular platform structures that allow independent integration of content, commerce, personalization, and analytics capabilities without reliance on monolithic systems.
Organizations are leveraging these architectures to accelerate digital innovation and reduce time-to-market for new customer-facing applications. For instance, businesses adopting headless content management systems have reported up to 30–40% faster content publishing cycles and improved omnichannel consistency across digital platforms.
In addition, the rising integration of AI-powered analytics, customer data platforms, and automation tools is enabling real-time decision-making and hyper-personalized customer engagement at scale. Growing investments in cloud-native digital infrastructure, particularly among large enterprises and digital-first companies, are further expanding opportunities for platform vendors to deliver scalable, intelligent, and fully integrated digital experience ecosystems.
North America Digital Experience Platform Market Scope
The market is segmented on the basis of component, deployment model, organization size, application, and vertical.
• By Component
On the basis of component, the North America digital experience platform market is segmented into platform and services. The Platform segment held the largest market revenue share of approximately 58.6% in 2025 driven by increasing demand for integrated content management, customer data platforms, and AI-powered personalization engines. Enterprises are widely adopting unified platforms to streamline customer journey orchestration, improve engagement, and enable real-time analytics across multiple digital touchpoints such as web, mobile, and connected applications.
The Services segment is projected to register the fastest growth at a CAGR of 12.4% from 2026 to 2033, driven by rising demand for implementation, integration, consulting, and managed services. Increasing complexity of digital transformation initiatives and growing need for continuous platform optimization are accelerating service adoption across large enterprises and mid-sized organizations.
• By Deployment Model
On the basis of deployment model, the North America digital experience platform market is segmented into cloud and on premises. The Cloud segment held the largest market revenue share of approximately 71.2% in 2025 driven by rapid enterprise migration toward scalable, flexible, and cost-efficient digital infrastructure. Cloud-based platforms enable faster deployment, seamless updates, and improved omnichannel content delivery, making them the preferred choice for modern digital experience strategies.
The On Premises segment is projected to register a CAGR of 7.9% from 2026 to 2033, supported by demand from highly regulated industries such as BFSI and healthcare that require greater control over data security, compliance, and system customization. Despite slower adoption, legacy infrastructure dependencies continue to sustain this segment in large enterprises.
• By Organization Size
On the basis of organization size, the North America digital experience platform market is segmented into small & medium enterprise and large enterprise. The Large Enterprise segment held the largest market revenue share of approximately 66.3% in 2025 driven by high digital transformation budgets, complex customer ecosystems, and strong adoption of AI-driven personalization technologies. Large enterprises are increasingly deploying integrated platforms to manage high-volume customer interactions and enhance omnichannel engagement strategies.
The Small & Medium Enterprise segment is projected to register the fastest growth at a CAGR of 13.6% from 2026 to 2033, driven by increasing availability of affordable cloud-based solutions and growing awareness of customer experience optimization. SMEs are rapidly adopting subscription-based digital experience platforms to improve competitiveness and expand digital reach.
• By Application
On the basis of application, the North America digital experience platform market is segmented into business to customer and business to business. The Business to Customer segment held the largest market revenue share of approximately 61.9% in 2025 driven by strong adoption across retail, e-commerce, media, and financial services industries. Increasing demand for personalized customer journeys, real-time engagement, and omnichannel communication is significantly boosting B2C platform deployment.
The Business to Business segment is projected to register a CAGR of 11.5% from 2026 to 2033, driven by increasing digitalization of enterprise sales processes, rising demand for account-based marketing, and growing use of digital platforms for partner ecosystem management and client engagement.
• By Vertical
On the basis of vertical, the North America digital experience platform market is segmented into retail, BFSI, travel & hospitality, IT & telecom, healthcare, manufacturing, media and entertainment, and education. The Retail segment held the largest market revenue share of approximately 24.7% in 2025 driven by rapid expansion of e-commerce, increasing omnichannel retail strategies, and strong demand for personalized shopping experiences across digital channels.
The BFSI segment is projected to register the fastest growth at a CAGR of 13.1% from 2026 to 2033, driven by increasing adoption of digital banking platforms, mobile-first customer engagement strategies, and AI-based personalization for financial services. Growing emphasis on customer experience optimization and regulatory-driven digital transformation is further accelerating adoption across the sector.
North America Digital Experience Platform Market Regional Analysis
U.S. Digital Experience Platform Market Insight
The U.S. dominated the digital experience platform market with the largest revenue share of 42.6% in 2025, supported by strong presence of leading technology providers, high enterprise digital maturity, and widespread adoption of AI-driven customer experience solutions. Rapid expansion of e-commerce, subscription-based digital services, and omnichannel engagement strategies across retail, BFSI, and media sectors is further strengthening market leadership.
Canada Digital Experience Platform Market Insight
Canada is projected to register the fastest growth in the digital experience platform market, driven by increasing adoption of cloud-based enterprise solutions, rising focus on customer experience optimization, and growing digital transformation initiatives across SMEs and large enterprises. Expanding investment in AI-enabled marketing technologies and omnichannel engagement platforms is further supporting market expansion across the country.
North America Digital Experience Platform Market Share
The North America Digital Experience Platform industry is primarily led by well-established companies, including:
• Adobe (U.S.)
• Salesforce (U.S.)
• Oracle (U.S.)
• Microsoft (U.S.)
• IBM (U.S.)
• Acquia (U.S.)
• Sitecore (U.S.)
• Optimizely (U.S.)
• HubSpot (U.S.)
• Episerver (U.S.)
• Liferay (U.S.)
• Sprinklr (U.S.)
• Verint Systems (U.S.)
• OpenText (Canada)
• Deloitte Digital (U.S.)
SKU-

- Interactive Data Analysis Dashboard
- Company Analysis Dashboard for high growth potential opportunities
- Research Analyst Access for customization & queries
- Competitor Analysis with Interactive dashboard
- Latest News, Updates & Trend analysis
- Harness the Power of Benchmark Analysis for Comprehensive Competitor Tracking
Data collection and base year analysis are done using data collection modules with large sample sizes. The stage includes obtaining market information or related data through various sources and strategies. It includes examining and planning all the data acquired from the past in advance. It likewise envelops the examination of information inconsistencies seen across different information sources. The market data is analysed and estimated using market statistical and coherent models. Also, market share analysis and key trend analysis are the major success factors in the market report. To know more, please request an analyst call or drop down your inquiry.
The key research methodology used by DBMR research team is data triangulation which involves data mining, analysis of the impact of data variables on the market and primary (industry expert) validation. Data models include Vendor Positioning Grid, Market Time Line Analysis, Market Overview and Guide, Company Positioning Grid, Patent Analysis, Pricing Analysis, Company Market Share Analysis, Standards of Measurement, Global versus Regional and Vendor Share Analysis. To know more about the research methodology, drop in an inquiry to speak to our industry experts.
Data Bridge Market Research is a leader in advanced formative research. We take pride in servicing our existing and new customers with data and analysis that match and suits their goal. The report can be customized to include price trend analysis of target brands understanding the market for additional countries (ask for the list of countries), clinical trial results data, literature review, refurbished market and product base analysis. Market analysis of target competitors can be analyzed from technology-based analysis to market portfolio strategies. We can add as many competitors that you require data about in the format and data style you are looking for. Our team of analysts can also provide you data in crude raw excel files pivot tables (Fact book) or can assist you in creating presentations from the data sets available in the report.


